|
Home
|
Phase Diagram
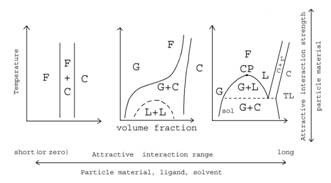
This is the phase diagram of the AO potential. Temperature is plotted along the y-axis and
the volume fraction of the polymer is plotted along the x-axis. There are three different plots showing
short, medium and long range interactions with the AO potential. My project deals exclusively with short
range interactions. As you can see in
the graph, this means that there is the gas phase and a crystal phase as well
as a small area where the two coexist.
Notice that the phase only depends on the volume fraction. My project consists of taking crystals
formed with one volume fraction and observing the sublimation when they are
moved to a smaller volume fraction.
|