Results
Home KamLAND Experiment Our Research Results About Me
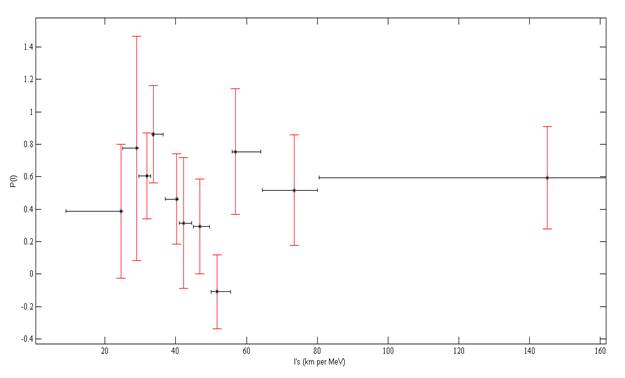
After testing the real N1 from the 4th KamLAND Data Release file, we got the following graph:
Comparing our N estimated from the P1estimate above with KamLAND’s N’1 obtained from the experiment, we got:
Chi square of the N between our estimate and the N observed:
6.68
Chi square of the P between our estimate and the closest straight line of 0.44 without taking into account covariance:
9.65
The above chi square with covariance:
67.95
The results from the chi squares show that the P1estimate that we obtained through our method is a good fit for the appearance probability, while a constant probability is not.
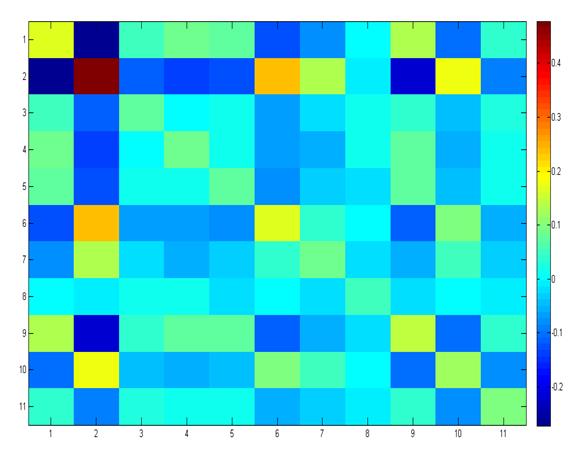
Covariance Matrix of C
Conclusions
After KamLAND’s counts data was run through our method, we obtained appearance probabilities for 11 values of L/Eν without assuming an average L. Even though the errors appear large,
the chi square accounting for covariance shows that not even the best fitted horizontal line of P(l) = 0.44 will fit the data obtained due to correlations between the data points.
Using the appearance probability graph obtained in this research, the predicted N matched KamLAND’s observed N based on the chi square.
We intend to apply the methods learned and used in this research to current and future experiments.
References
• KamLAND 4th Data Release File: http://www.awa.tohoku.ac.jp/KamLAND/4th_result_data_release/4th_result_data_release.html
• KamLAND Probability graph: http://arxiv.org/pdf/1009.4771v2.pdf
• All detector pictures: http://kamland.lbl.gov/
This program is funded by the National Science Foundation through grant number PHY-1157044. Any opinions, findings, and conclusions or recommendations expressed in this material are those of the author(s) and do not necessarily reflect the views of the National Science Foundation.