The KamLAND Experiment
Home KamLAND Experiment Our Research Results About Me
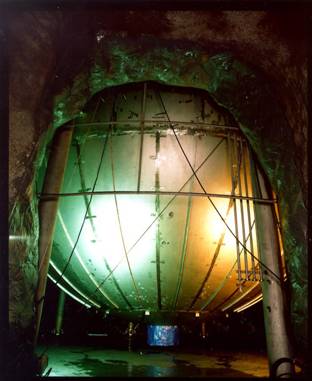
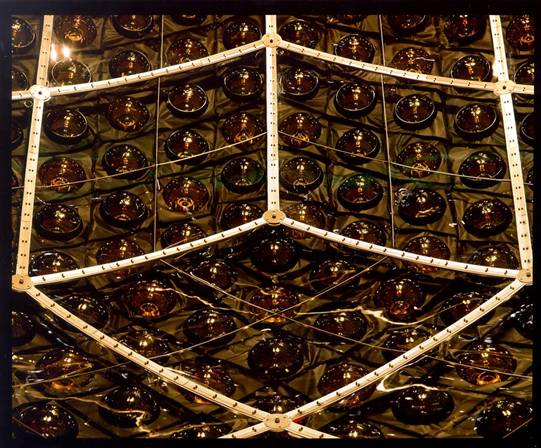
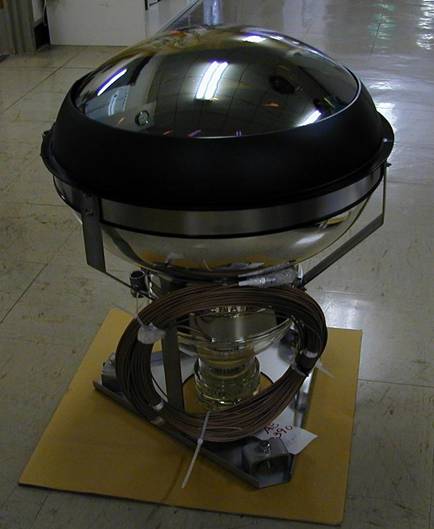
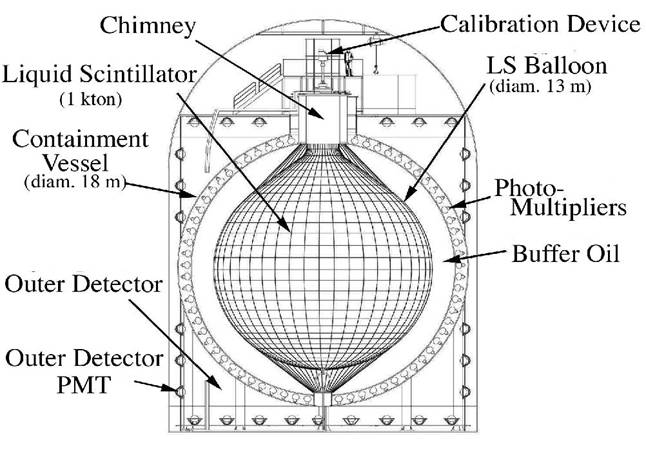
The detector balloon
The KamLAND experiment, with its base location on the island of Honshu, Japan, consisted of 56 nuclear reactor sources at different distances containing Uranium 235 and 238, and Plutonium 239 and 241. The fission within the reactors occurred 57.1% from the U235, 7.8% from the U238, 29.5% from the Pu239, and 5.6% from the Pu241. This spontaneous fission produced neutrons that experienced beta decay creating certain anti-neutrinos that eventually reached one detector. From the anti-neutrinos that arrived at the detector, some of them would interact with a proton found in the Liquid Scintillator, which was mostly made up of pseudocumene and dodecane. These interactions produced neutrons and positrons through inverse beta decay. The positron from an interaction would ionize an atom and, hence, would keep losing energy as it moved through the Liquid Scintillator. The ionized atom would give off a UV/gamma photon (10 keV) that would then hit a molecule in the scintillator, and because these were fluorescent molecules, it would then emit a visible or optical photon (1-3 eV) that was detected by all the Photo-Multiplier Tubes located in the detector. Once the positron in each interaction came to a stop, it annihilated with an electron giving off two gamma photons that would then either Compton scatter or go through the photoelectric effect, producing more signals in the detector. All these different signals, however, were detected as one signal instead of multiple because the detector could not make such precise measurements and the time elapsed between each of these signals was incredibly short.
Simultaneously in the Liquid Scintillator, the neutron was bouncing off the atoms, recoiling and slowing down until it was absorbed by an atom. When it was absorbed, most of the times it produced a deuteron that gave off a gamma photon and Compton scattered or went through the photoelectric effect, producing a delayed coincidence signal. The experiment measured the number of counts of each prompt energy, or Ep, detected from the incoming anti-neutrinos, and it was primarily looking to figure out an appearance probability for these anti-neutrinos to, then, be able to decipher a value for Δ m^2 and theta 12.
The way the appearance probability was determined, however, was by calculating the ratio of the number of events with oscillations to the number of events with no oscillations. The appearance probability was then plotted vs L0/Eν, where Eν=0.8 MeV + Ep and L0 is the average reactor distance, and the number of Ep counts was plotted vs the actual Ep's observed.
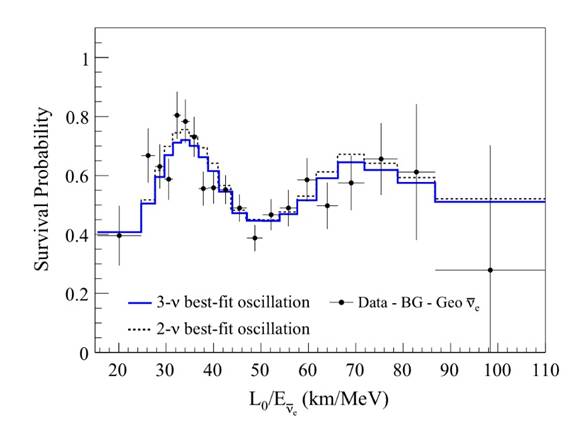
From these two graphs, KamLAND chose values for both Δm^2 and theta 12 that made their theoretical equation fit the events graph the best. Their theoretical equation did provide a very close approximation of the graphs for the values chosen. However, the appearance probability graph constructed was based on the events graph data and not empirically calculated values.
This program is funded by the National Science Foundation through grant number PHY-1157044. Any opinions, findings, and conclusions or recommendations expressed in this material are those of the author(s) and do not necessarily reflect the views of the National Science Foundation.