|
Forecasting
Ability of a Periodic Component Extracted from Large-Cap Index Time Series, M.J. O’Shea, Journal of Forecasting, M. J.
O’Shea, 5 April 2016 (2016)
The ‘Sell in May and buy at
Halloween’ adage has been around for many years and quoted by stock market
pundits. If there is any truth to
this adage, then there must be a periodic component embedded in the price
of indices. A visual inspection
indicates that large cap indices have stochastic (noisy) and other
non-periodic contributions. If such
a periodic contribution is present it is hidden in these much larger
contributions. It’s important to
note that this contribution does not have to be perfectly periodic – it can
have variations in period and variations in amplitude. Two properties of this quasi-periodic
component must be present:
·
it’s repeat time must vary about a certain average value with the
variations about the average period being significantly smaller than this average
period
· the variations in amplitude must not
average to zero.
It
is very difficult to use standard methods such as Fourier/spectral analysis
to extract such a component. In
general, it is not possible to uniquely separate such a quasi-periodic
component from these other contributions mathematically. It is however possible to determine the
average contribution of this quasi-periodic term. This can be done by folding the time
series to average out the large non-periodic contributions leaving behind
the average of the quasi-periodic contribution. This folding leads to a so-called
repetition function.
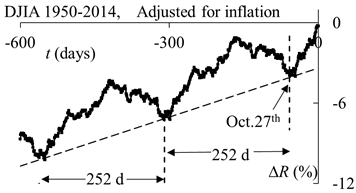 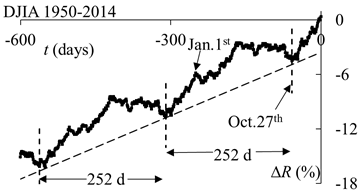
This repetition function is
shown above for the Dow Jones Industrial Average. A clear periodicity is
present with a maximum in May/June and a minimum in October. Scaling the Dow Jones Industrial Average
with the cost of living index removes some of the gradient but the averaged
periodic term is still present. We
looked at eight large cap indices and similar periodic terms were present
in six of them.
It’s important to note that the
presence of a quasi-periodic term does not mean that an investor can take
advantage of it. To see if this
average periodic term has any predictive power out-of-sample tests were
done and indicate some limited predictive power for each of the indices
exhibiting a quasi-periodic term.
Caution: None of this is
investment advice; it is simply work looking at the predictive power of a
quasi-periodic term extracted from a time series.
To give insight into the
method, test data was generated and analyzed here using
this method. This folding method, the autocorrelation
function method and spectral/Fourier Analysis are compared.
The effect of outliers is
considered here.
Finally the repetition
functions of all the DJIA components are given here.
|