|
Forecasting
ability of a periodic component extracted from large-cap index time series
- Effect of outliers on the repetition function. M. J. O’Shea, Jour.
Forecasting
We present further details of our checks (the
third check of section 2 of our paper) for possible outlier influence on
the observed periodic term in the repetition function for the DJIA.
Initially we removed the years 1987 and 1998 which
contain the October 1987 crash in equities and the August 1998 collapse of
Long-Term Capital Management which Maberly and
Pierce (2004) suggested as a cause of the calendar anomaly. This is done by removing the
appropriate tk in Eq. (5). The repetition function for this case is
shown in FigureA6(b) and there is no significant change as compared to
Figure A6 (a) where we re-produce the original repetition function with no
years removed.
To identify outliers in a more systematic way we
removed years that had the largest change (increase or decrease) in the
DJIA in the range 1950 to 2014 by removing them from the sum in equation
(5). We choose to remove the years
associated with the three largest positive and the three largest negative
changes. This repetition function is shown in
Figure A6(c) and the periodic pattern is intact and similar to Figure
A6(a). Thus outliers as defined
above do not play a major role in producing this periodicity.
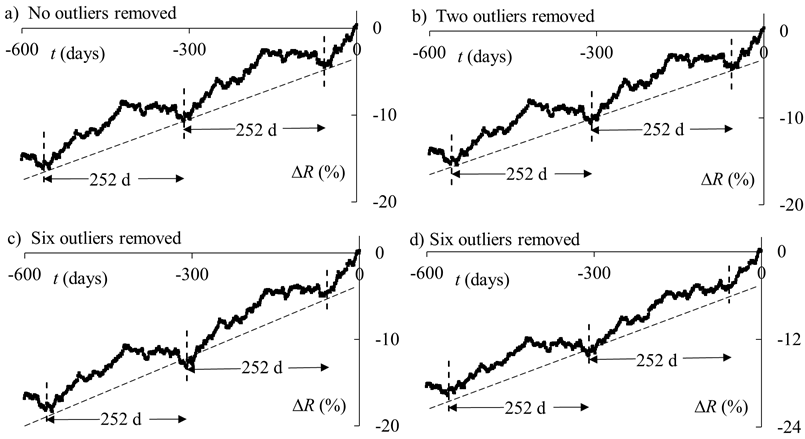
Figure A6. The repetition function for the DJIA
index (1950-2014) for selected circumstances. The tk of
equation (5) are set equal to the first business day of each year. a) The repetition function for the
time-span 1950-2014. b) Two outlier
years (1987, 1998) are removed, c) six outlier years (1954, 1958,
1966, 1974, 1975, 2008) are removed,
d) six outlier years (1987, 1989, 1997, 2001, 2002, 2008) are
removed from the sum in equation (5).
The vertical dashed lines indicate the yearly minima and the sloping
dashed lines are the trend lines, third term of equation (3).
To test the robustness of the hypothesis that
outliers do not play a major role in producing the periodic term we define
outliers in an alternative way. The
distribution of percent changes in the form of a probability density
function (PDF) is first determined.
We have performed this analysis for three cases: looking at the
frequency of percent changes over one day, one month, and three months. As other workers have already shown (Gopikrishnan et al., 1998) we find that
each of these PDF’s is not a normal distribution and so deviations from a
normal distribution cannot be used to identify outliers. Plotting the PDF on a logarithmic scale
reveals approximate power law behavior of the tails as seen by other
workers (Gopikrishnan et al., 1998; Pan and Sinha,
2007; Mu and Zhou, 2010). For
the largest percent increases and decreases each of these PDF’s show some
deviation from a smooth curve. An
example for the case of the PDF for one-day changes is shown in Figure A7
and the largest deviations occur for price changes greater than or equal to
6.9 %. Thus we define all years that
contain a day where the change in price (increase or decrease) is greater
than or equal to 6.9 % to be outliers and these are indicated by the
labeled bracket.
These years are removed from the summation of equation (5) by removing the appropriate tk. Figure A6(d) shows the repetition function after removal of these
outlier years. The periodic term is
intact though somewhat reduced indicating these outliers are not the only
years that play a role in producing this pattern.
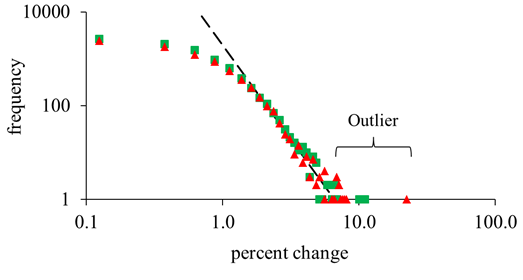
Figure A7. The
frequency of percent changes for a time interval of a day for the DJIA
index for the time-span 1950-2014. The increments of change in price are
one quarter percent and the plot is in a log-log form. The green squares are price increases and
the red triangles are price decreases.
Power law behavior is observed for large % changes as indicated by
the dashed line.
Gopikrishnan P, Meyer M, Amaral LAN, Stanley HE. 1998. Inverse cubic
law for the distribution of stock price variations. Eur. Phys.
Jour. B3, 139-140.
Maberly ED, Pierce RM. 2004. Stock
Market Efficiency Withstands another Challenge: Solving the “Sell in May/Buy
after Halloween” Puzzle. Econ Journal Watch 1, 29-46.
Mu G-H, Zhou W-X. 2010. Tests of Nonuniversality of the Stock Return Distributions in an
Emerging Market. Phys. Rev. E 82,
066103. http://dx.doi.org/10.1103/PhysRevE.82.066103
Pan RK, Sinha S. 2007. Self-Organization of Price Fluctuation
Distribution in Evolving Markets. Europhys. Lett.
77, 58004. doi:
10.1209/0295-5075/77/58004
Outlier
years identified in the range 1950-2014 using this alternative definition
are: 1987, 1989, 1997, 2001, 2002, 2008.
|