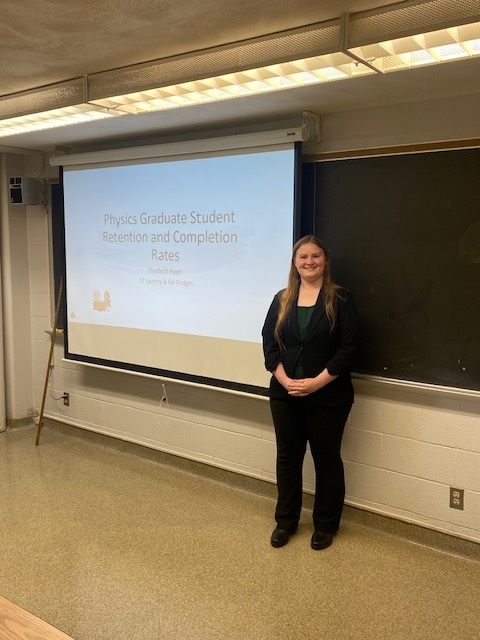
Physics Graduate Student Retention and Completion Rates
Elisabeth Hager, Penn State, Physics Major
Mentored by Dr. J.T. Laverty

This project is about verifying equations for measuring retention and completion rates in physics graduate schools. Retention and completion rates are important for institutions to know, so that they can best improve student success. However, while there are some studies done on retention and completion, there were no equations made on an institutional level. My group has been creating some of these measures, and my role has been to verify those equations and ensure that everything was done correctly.
We are using four variables that come from the surveys done by the American Institute of Physics (AIP). AIP surveyed 284 institutions between the years 2000 and 2022 for these four pieces of information.

These are used to find information about both retention and completion rates. For any equation, if data is missing, then the equations output nothing so that missing data does not affect results too drastically.
Retention rates are intended to represent the percentage of people who stay enrolled or get a degree between two years. We created a new variable called N which dictates the number of people who unenroll without getting a degree, and use that to find retention as a percent. These retention values can be calculated either nationally or institutionally.

Something in the AIP data led the retention to be over 100% about a quarter of the time, which was not expected. This is not an error in how the calculation or programming was done, but instead something in how the AIP dataset works has led to a large number of people appearing enrolled without ever being tracked as a first year.

Completion rates are another important aspect to measure. The completion rate for both Master’s and PhDs are found similarly. Both track cohorts of first years, then check either 2 years or 6 years, depending on the degree, to see how many have gotten their respective degrees by that time. There are two ways to calculate completion rates. The first option is to check how many degrees are awarded after the exact duration of time expected. The other option is to track it more loosely, taking the average over three years. The second option gives us a more realistic time frame, as not everyone will take exactly 2 years for a Master's or 6 years for a PhD.

The resulting national graph for the PhD completion rate is closer to the expected results, as it shows a 50% to 60% completion rate.

One issue with the AIP dataset is that there is a lot of missing information. Many institutions do not provide all required variables to find retention or completion results, and a single missing data point can invalidate multiple years of retention or completion calculations. The frequency of missing cells also varied drastically from year to year, which risks some corresponding variance in the national results as well. The total student population variable has the largest changes out of any of the four variables.

My comparison did verify that my group had performed all calculations correctly except for one error in the 2009 Master's Completion Rate for all institutions. This error has since been fixed.
There are other graduate institution datasets out there, including IPEDS and GSS, that could be used to provide similar retention and completion information. These could be used to compare with the results of the AIP data, along with gaining more information about retention across different student demographics. The remainder of my project was beginning to verify some of the work my group did with these other datasets.
References
D. Sachmpazidi and C. Henderson, Departmental support structures for physics graduate students: Development and psychometric evaluation of a self-report instrument, 17, 010123. C. M. Golde, The Role of the Department and Discipline in Doctoral Student Attrition: Lessons from Four Departments, 76, 669. AIP Statistical Research, www.aip.org/statistics
Acknowledgments