Characterizing Carbonate Mineralization in Local Konza Prairie Soils
Leopold Grossman, Reed College, Physics Major
Mentored by Dr. Bret Flanders
This summer, my group focused on characterizing the growth of carbonate minerals, such as calcium carbonate, in natural settings. To grow crystals in
systems compatible with our instruments, my group collected topsoil from the Konza Prairie (a 20-minute drive from K-State). We stirred this soil with
either DI-water or alkaline (sodium-rich) water at a 1:1 mass ratio until a muddy slurry emerged. This slurry was placed in a centrifuge, resulting in an
optically clear supernatant.
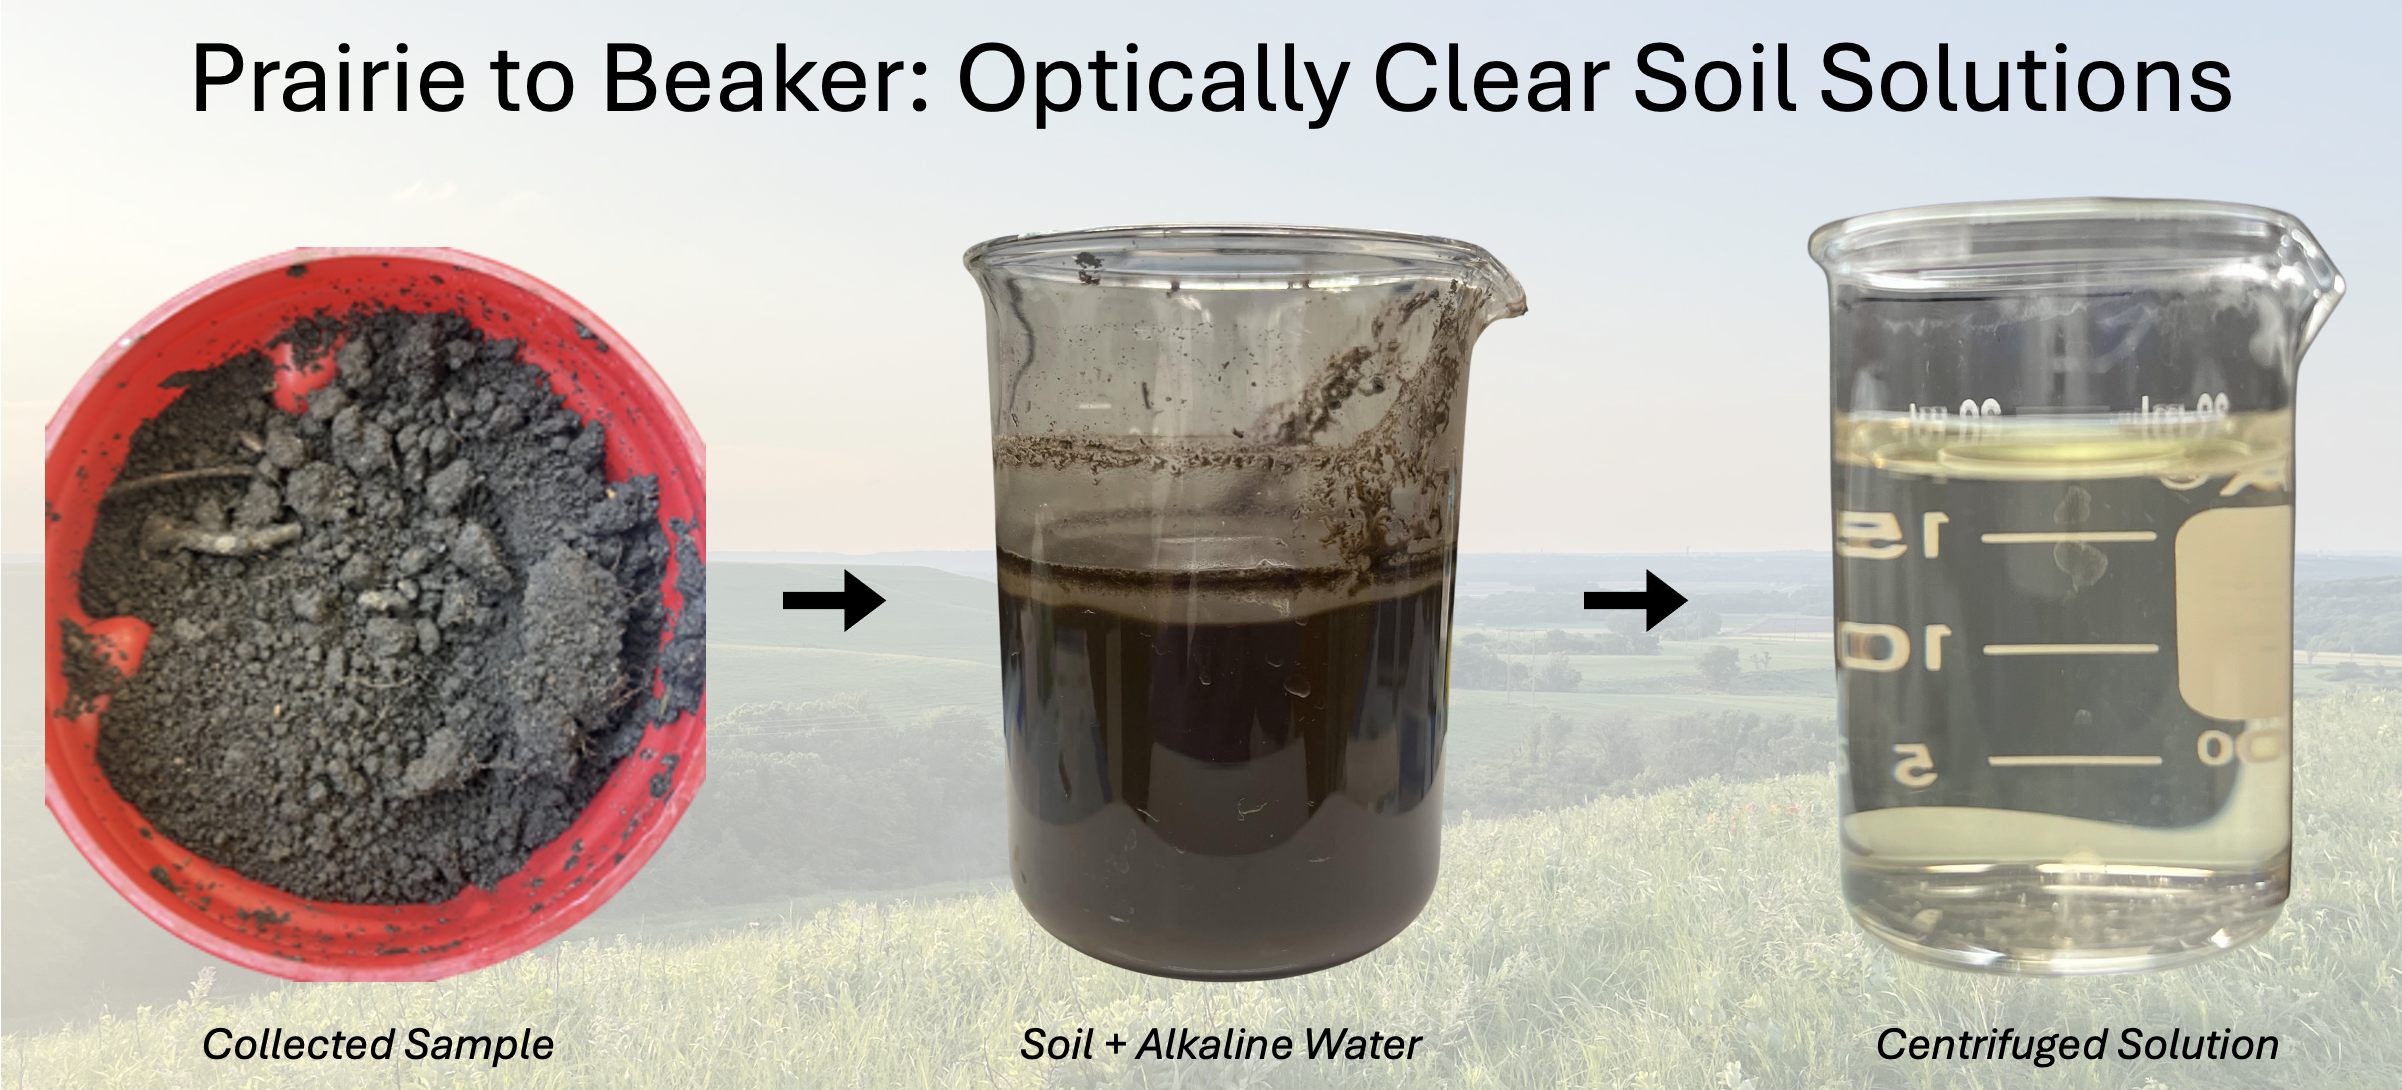
Fig. 1. Optically clear supernatants were constructed via a series of centrifugations and filtrations. The supernatant chemistry is shown to remain fairly
consistent.
Our supernatants were studied in depth, using both common and advanced measurement techniques. Simple measurements, such as conductivity and pH measurements, were taken at various points in the process. Atomic emission spectroscopy (AES) was used to characterize the cationic content of the final products.
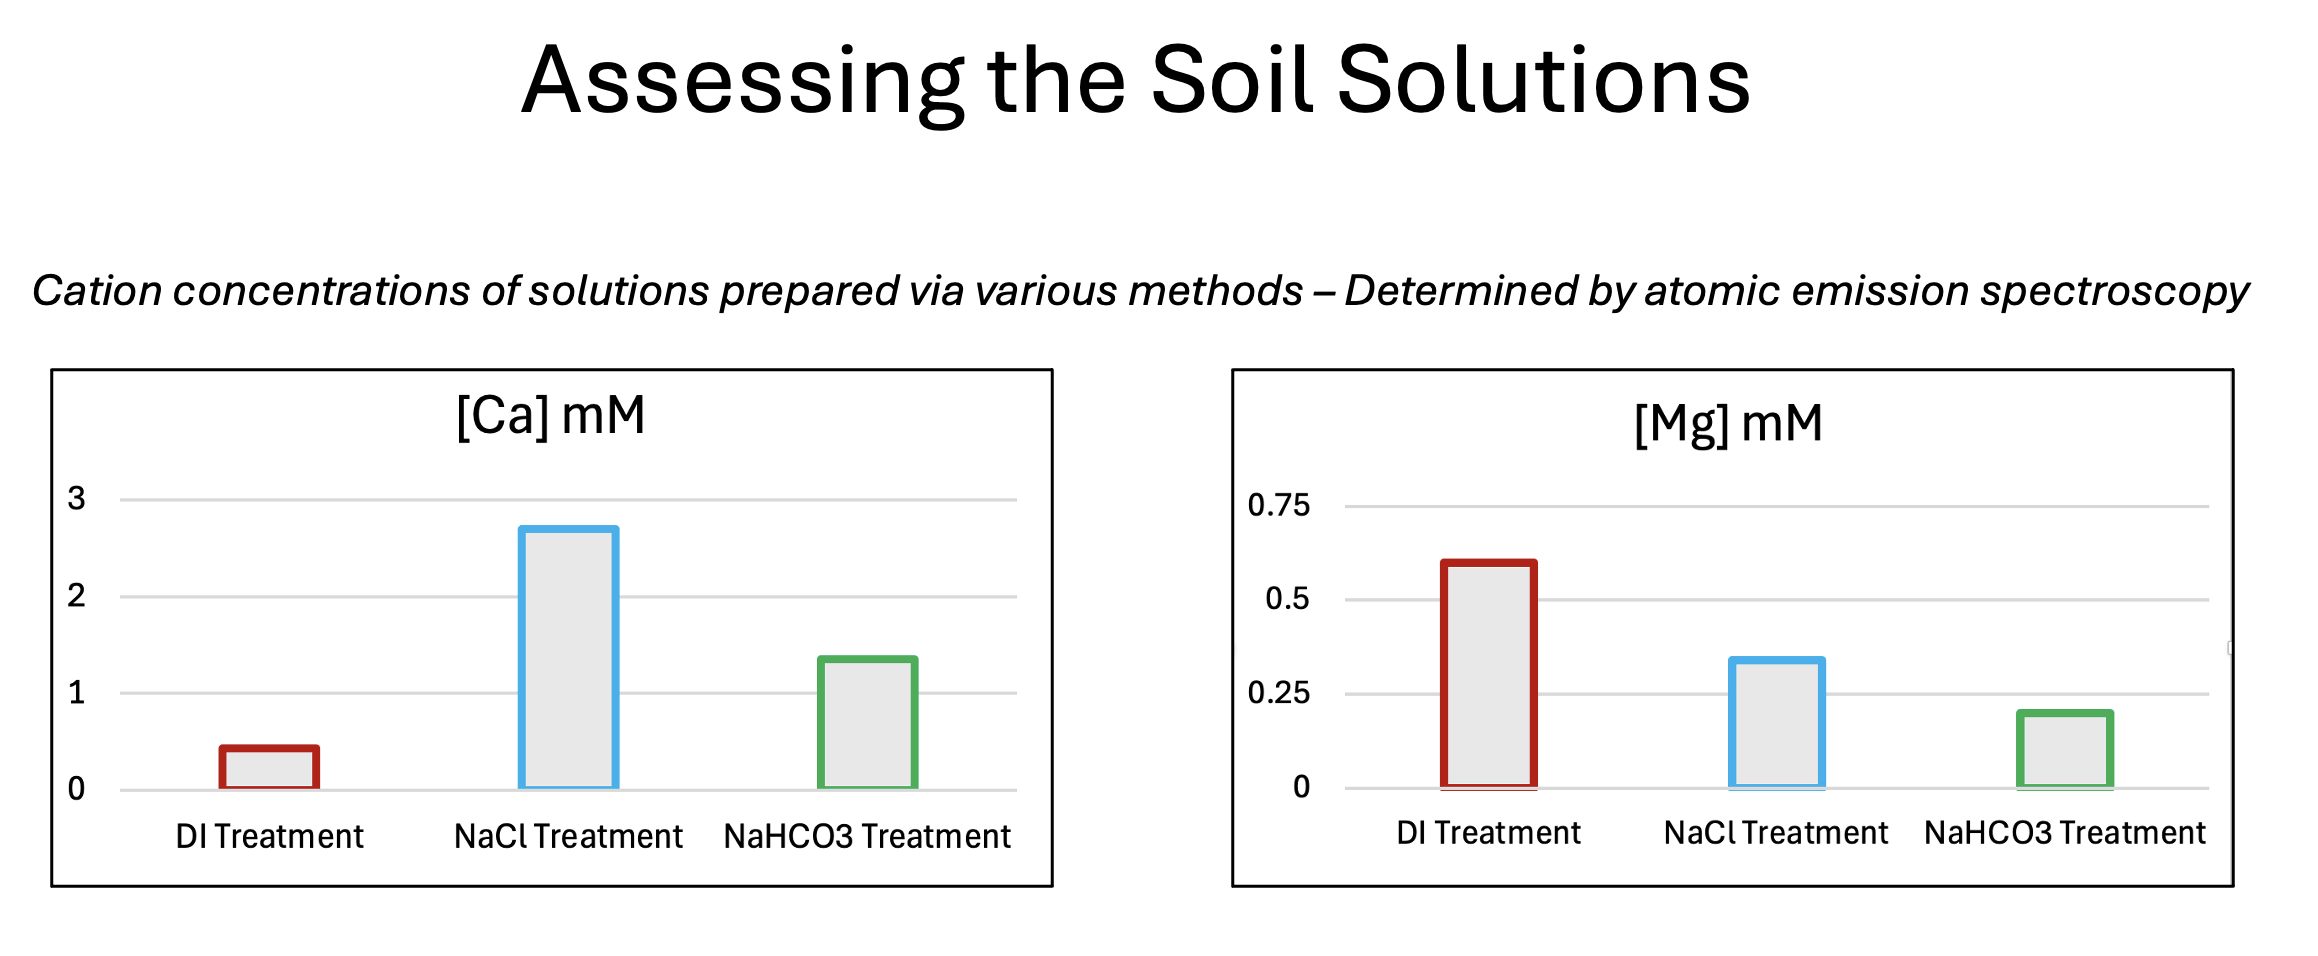 Fig. 2. Supernatant cationic contents vs. different preparation methods. The addition of sodium during the stirring process generated calcium-rich supernatants.
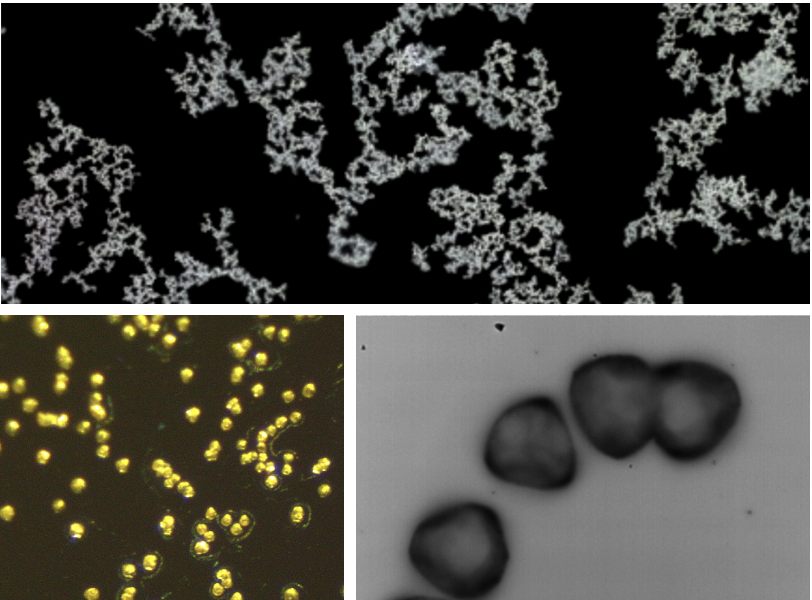
Several crystals were grown in our supernanants, varying in size, structure, and properties.
In order to determine the molecular structure of the crystals, two tools were employed. Raman spectroscopy was used to determine that the crystals did indeed include carbonates. AES was used to determine that the dominant cations present were calcium, indicating that the crystals were, by and large, calcium carbonate.
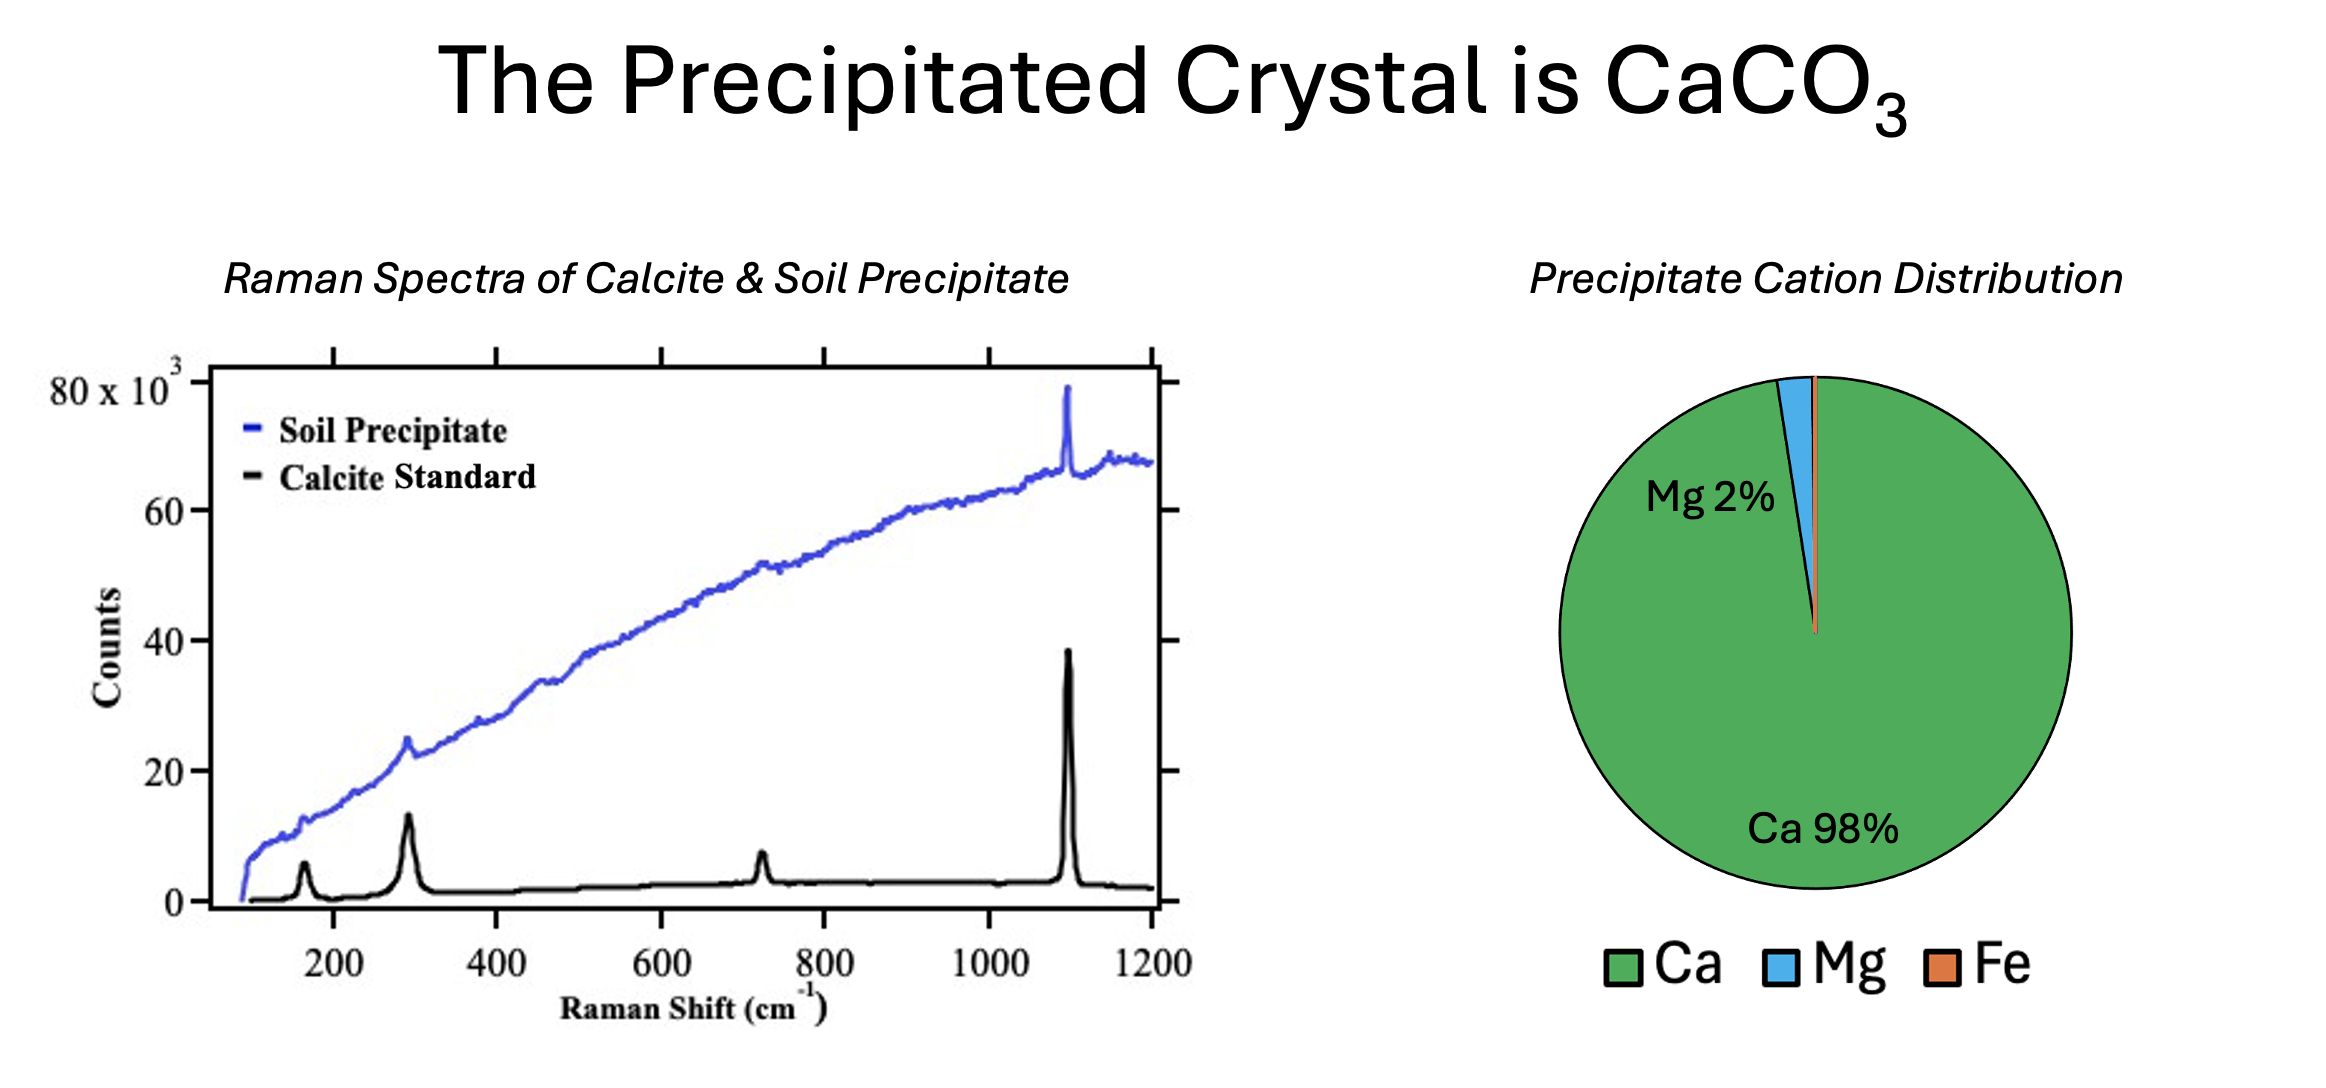
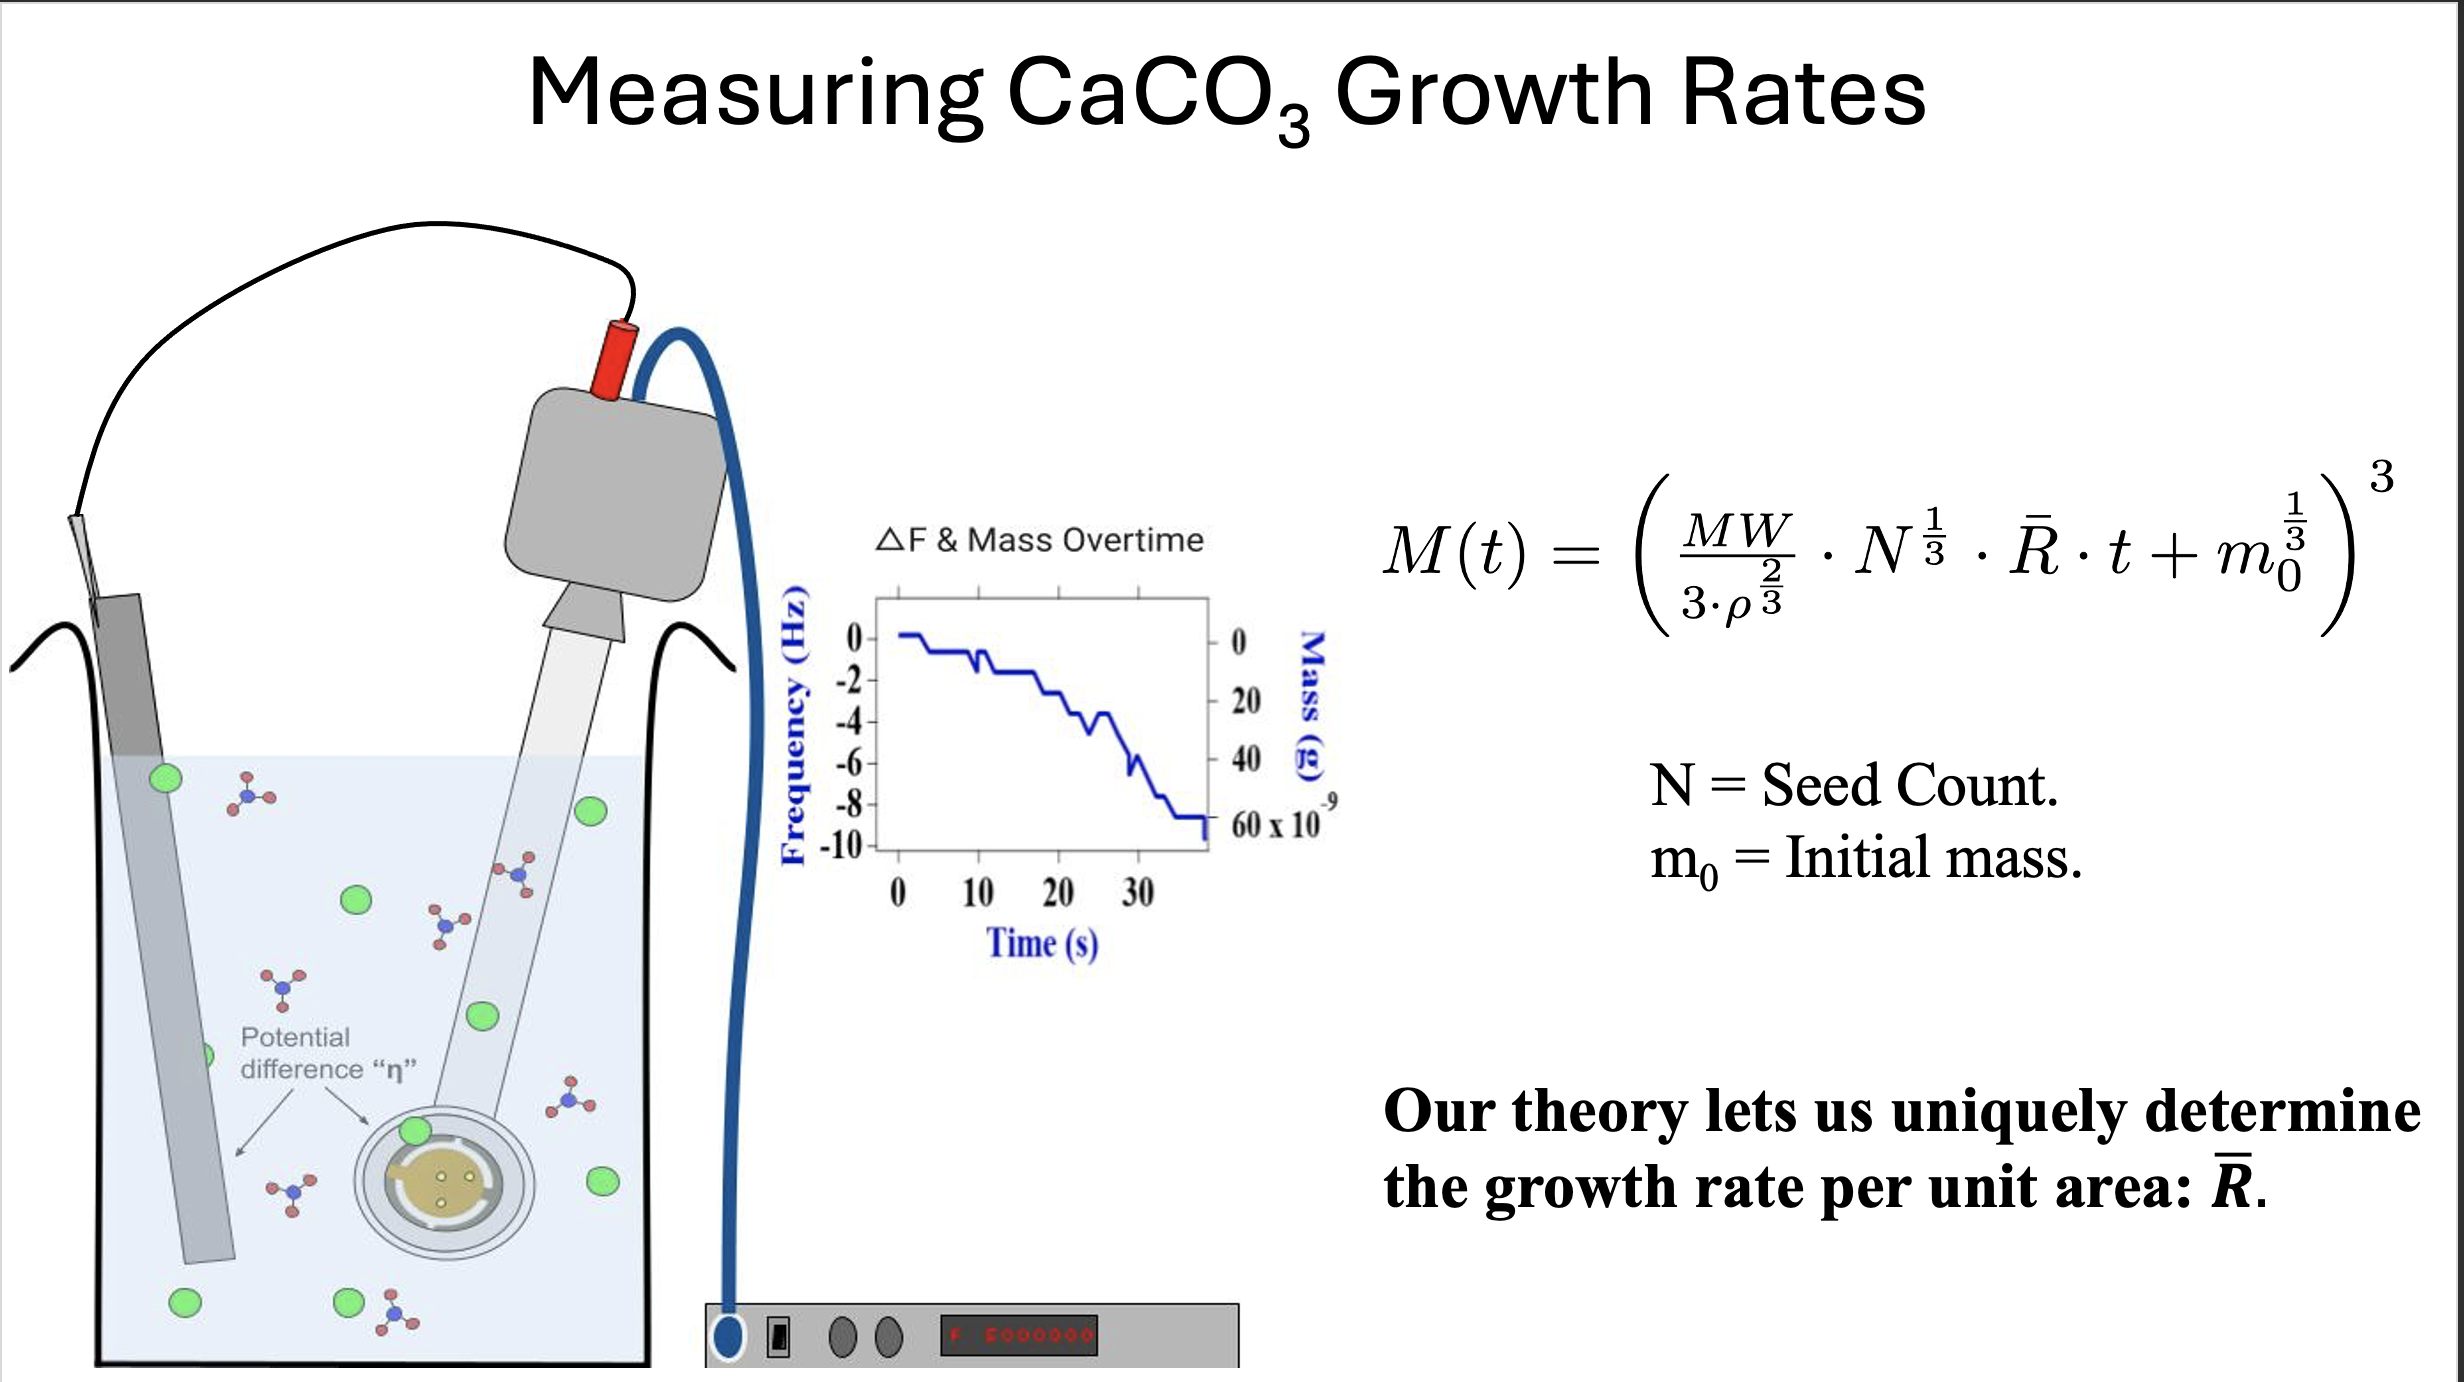 Fig. 5. A schematic of a typical growth experiment. Crystals form on the submerged gold surface, the working electrode. The crystal mass is measured in real time. This schematic includes a second electrode, connected to the working electrode. The resulting potential difference induces a series of chemical reactions, ultimately enhancing the growth rate of calcium carbonate crystals. This technique was employed in otherwise slow-growing supernatants.
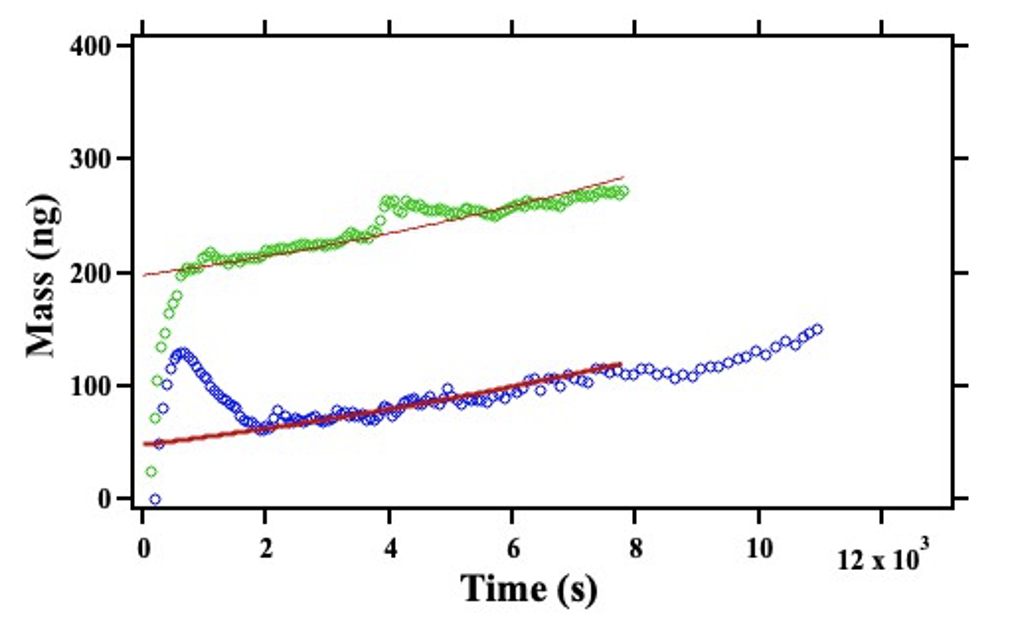 Fig. 6. The crystals were further investigated under total internal reflection (TIRF) microscopy, revealing intense fluorescent behavior. This was likely owing to organic fluorophores trapped within the layers of the crystals. The fluorescent spectra of our crystals were quite similar to those of chlorophyll, a common organic fluorophore, and one certainly present in soil
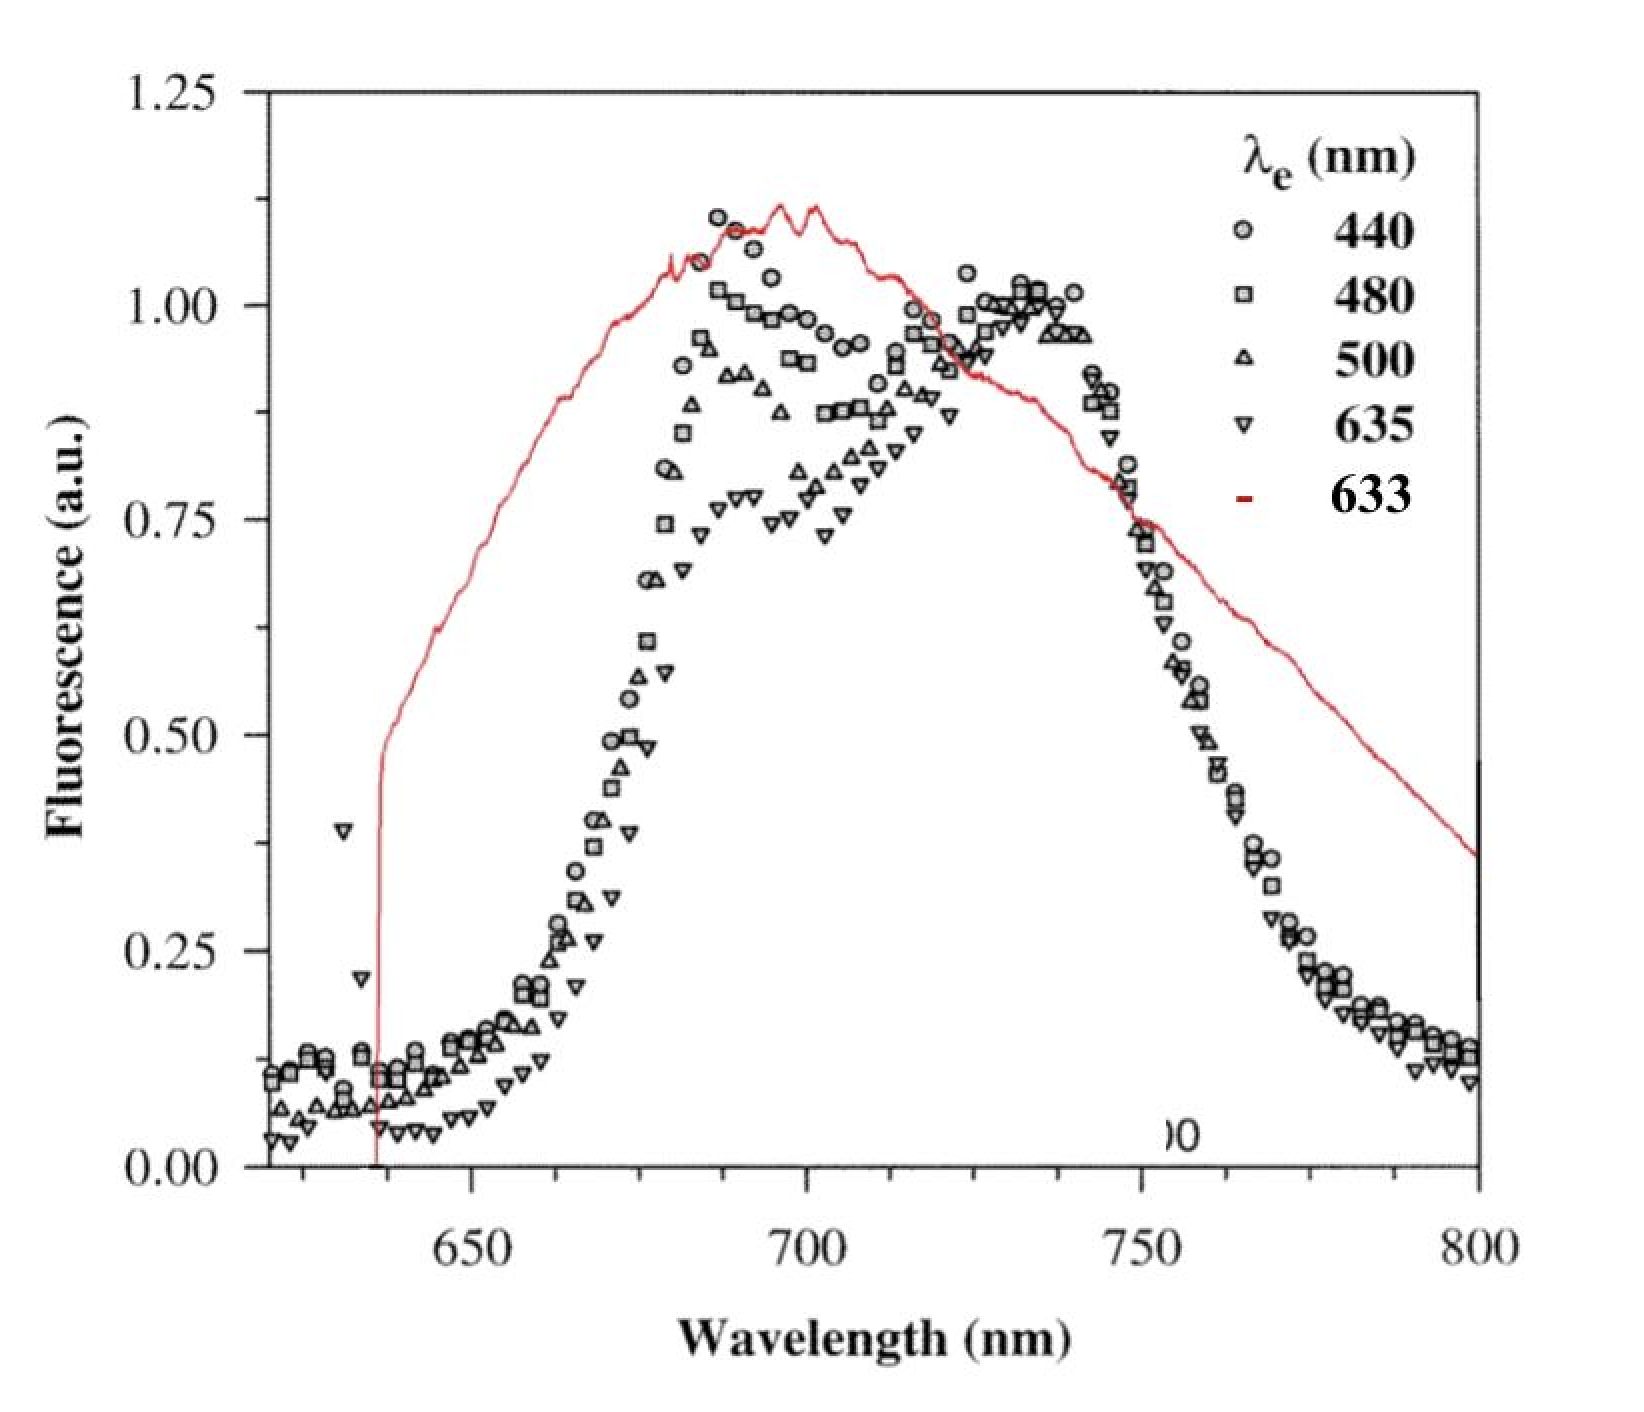 Fig. 7. The chlorophyll fluorescence spectrum of a Ficus benjamini leaf at various excitation wavelengths vs. the fluorescent spectrum of Flanders Group soil. (Giovanni Agati 1998 Pure Appl. Opt. 7 797).
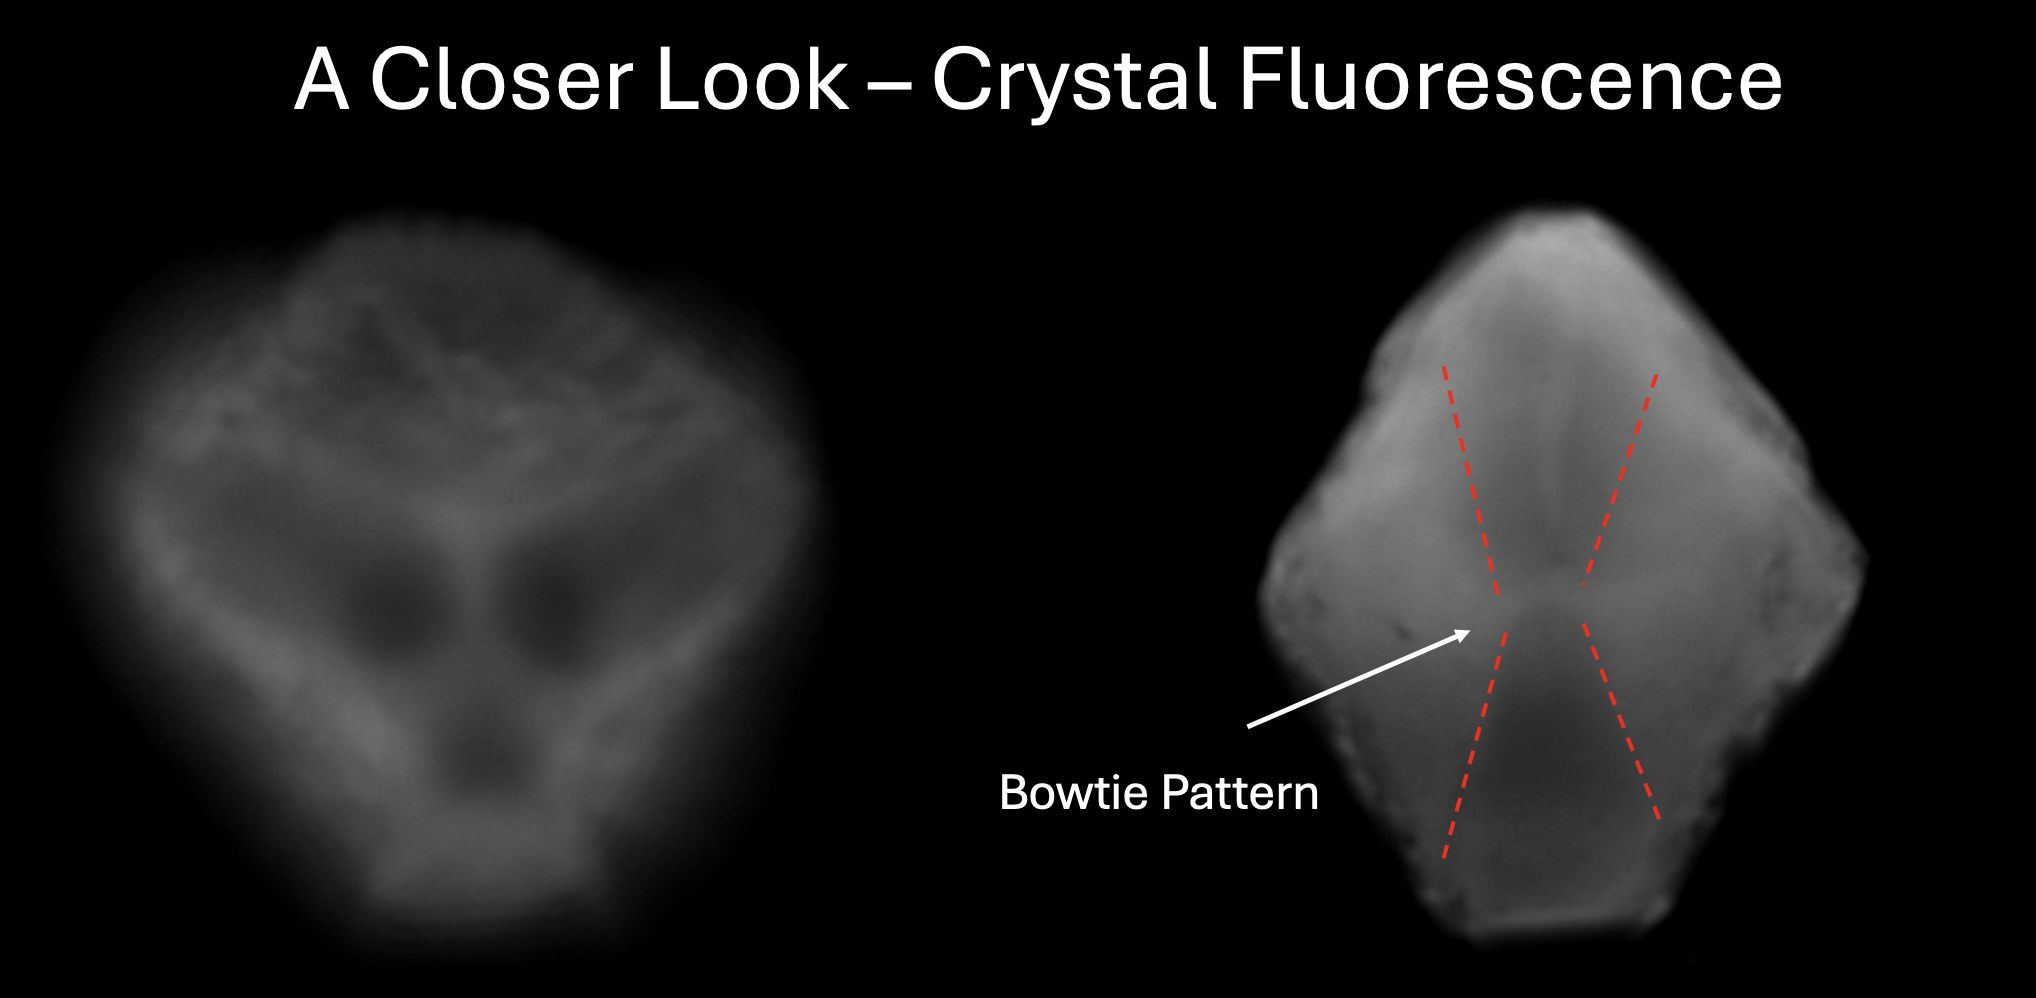 Fig. 8. Images displaying the fluorescent behavior of our supernatant-grown crystals.
By the summer's end, we successfully constructed natural solutions, albeit compatible with our instruments, in which we synthesized calcium carbonate crystals. We were able to characterize the solutions and crystals via common and advanced techniques, and determine their rates of growth. Furthermore, we began an investigation into the curious fluorescence present in our crystals.
Acknowledgments
This material is based upon work supported by the National Science Foundation under Grant No. 2244539. Any opinions, findings, and conclusions or
recommendations expressed in this material are those of the author(s) and do not necessarily reflect the views of the National Science Foundation.