Photoionization modeling of Methyl-Oxirane
Derek Wignall, University of Minnesota - Twin Cities, Physics Major
Mentored by Dr. Loren Greenman
Chirality is defined by a molecule’s inability to be superimposed on its mirror image, as demonstrated in Figure 1. Chiral molecules are extremely prevalent in nature, with most proteins being chiral, making the study of chirality important for the fields of medicine and biology (such as in the development of medications). Photoionization, a method of impacting a molecule with a beam of photons with the intention of exciting its electrons enough to leave the molecule, is particularly useful in the study of chiral molecules. When an electron is ejected, the angular distribution of that electron can provide a great amount of information on the chirality of the molecule. More specifically, when a chiral molecule is struck by either left or right circularly polarized light, it behaves differently, projecting the electron in a different direction. The resulting collection of angular distributions is called Photoelectron Circular Dichroism (PECD), as seen in Figure 2, and is primarily useful in determining the specific chirality of a molecule [1]. Theoretical experimentation into PECD has been conducted by Corbin Allison in the 2023 REU, so photoionization will instead be focused on in order to comprehend the reasoning behind why an electron is ejected from the molecule in any specific direction.

Fig. 1. Methyl-Oxirane (C3H6O) is demonstrated to be a chiral molecule, and is the specific focus of this project due to its popularity in study. The molecule is mirrored, but clearly not superimposable onto itself.
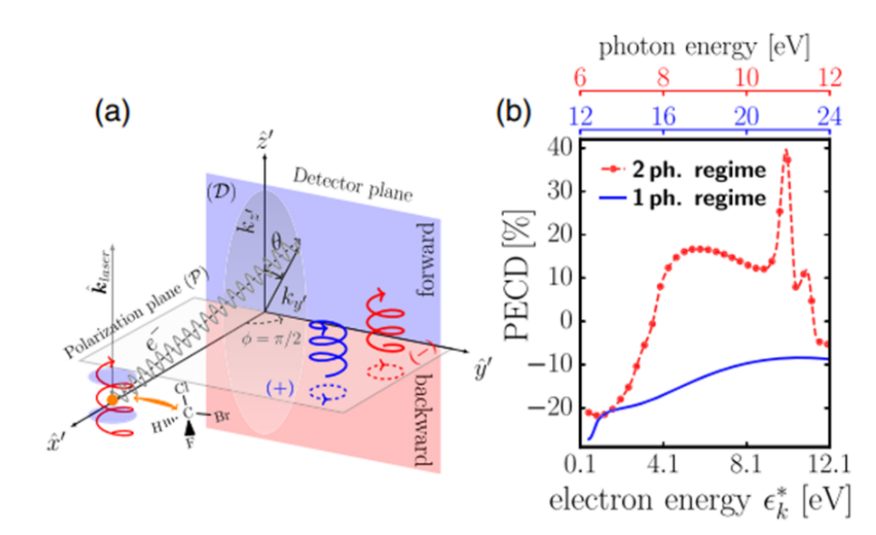
Fig. 2. Photoelectron Circular Dichroism demonstrated through the resulting angle of ejection an electron takes after being photoionized. Plot (a) shows the differences between forward and backward circularly polarized light (left/right) in trajectory, and plot (b) shows the angle of ejection as a function of the electron’s energy, for both a single- and two-photon transmission [2].
Photoionization requires a large amount of theory to correctly calculate, such as using both grid-based and smart basis gaussian methods. It involves a multi-step process of generating two separate wavefunctions, one which requires complete knowledge of the initial state, and one which requires knowledge of both the final state of the molecule, as well as the resulting electron [5,6]. Eq. 1 represents all information about the electronic states of the system, collected in the photoelectron element matrix. Eq. 2 demonstrates the particle wave expansion for the emitted electron.
Eq. 1 and 2
Because of this, the process is typically simplified in many different manners in a computational program. The largest simplification can be seen in the manner of calculating the correlation effects of the quantum electron, or the lack thereof. By removing these electron correlations, the wavefunction does become simpler, but information is lost which may be vital to understanding the results of an experiment.
Thus, the clear step that must be taken is to determine the impact of this information on final photoionization modeling, and thus the resulting PECD. In order to do this, we can use a program called UKRmol+, in which any electron correlations are taken into account. It does this using a method of representing and solving Schrodinger equations known as the R-matrix method [3]. In this, two separate regions are generated, an inner and outer shell as seen in Figure 3, in which the Schrodinger equation is separately solved and joined in the end. These two regions represent different interactions. In the inner shell, the wavefunction is considered in a bound state, while in the outer shell the wavefunction is solved as a continuum state. By doing this, a more complete model of the photoionization can be determined.
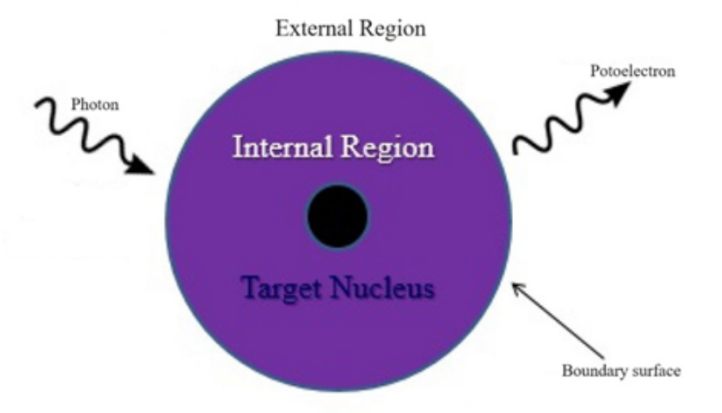
Fig. 3. A visual representation of the R-matrix method of calculating photoionization wavefunctions [4].
My main project goal for the end of the summer is to use this code to generate photoionization calculations for the molecule C2H6O (methyl-oxirane). This is done in an attempt to match the results to an existing experiment, which has been done previously with lower theory programs (ePolyScat). These programs, though fitting well in some cases, do not fit the data at all in others, as demonstrated in Figure 4. By removing simplifications, the new calculations could theoretically act as a better fit than what has been done in the past. This would allow us to analyze the results from the experiment, as well as theorizing how the quantum nature of the molecule and resulting electrons impact calculations. This comparison will be able to be made in future projects.
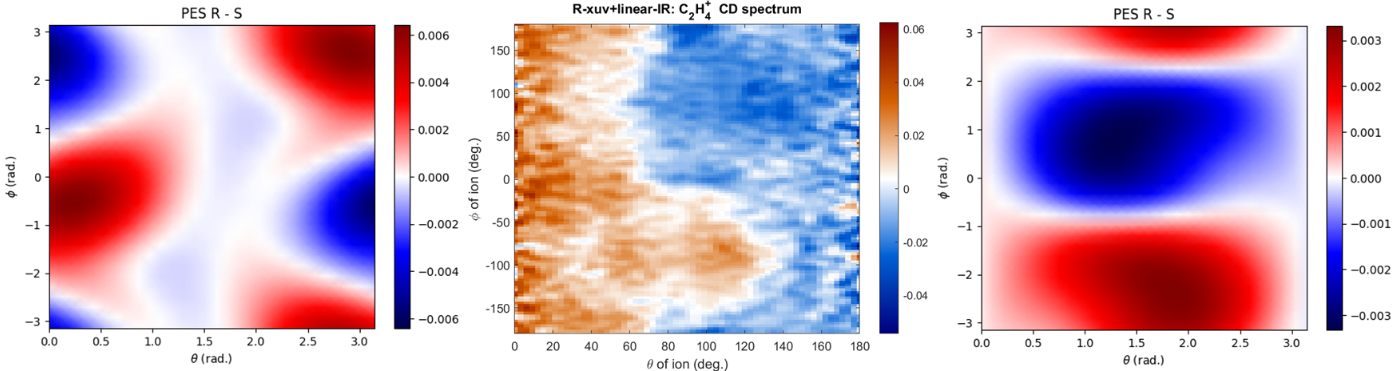
Fig. 4. A comparison of the fragmentation angles of C3H6O, specifically C3H4+ off of the molecule, between two theoretical results (left and right), and the experimental result (middle). The right plot demonstrates a decent match to the experimental, while the left plot does not.
Otherwise, small projects which contribute to the overall C3H6O study were also conducted. Photoionization calculations were completed on an H2 molecule, using both a symmetrical and asymmetrical case for the molecule, and the results were compared (Fig. 5). Furthermore, a CASSCF study was conducted on C3H6O , in that the active space of the molecule was changed, resulting in Single-Point Hartree-Fock operations that demonstrated a change in the Lowest Unoccupied Molecular Orbital (LUMO) and its electron distribution (Fig. 6). This is useful in determining some of the impact that adding in electron correlation into photoionization has, as Hartree-Fock is a quantum chemistry-based Schrodinger equation estimation method. Using the results obtained, it can be predicted what size of active space the molecule will stop changing in electron configuration, hence allowing a suitable active space to be determined for the final photoionization calculations.
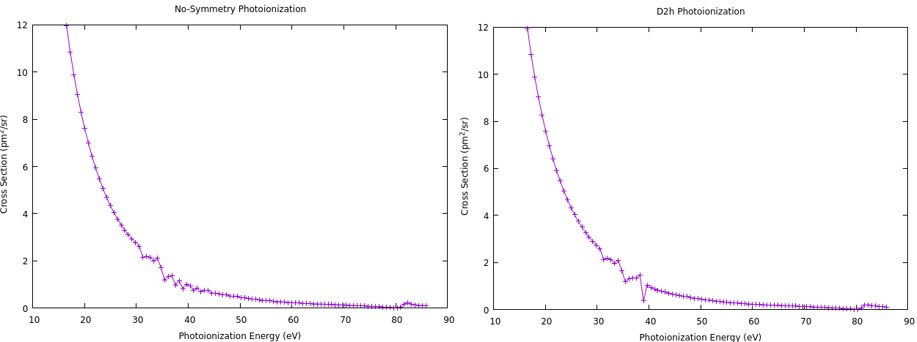
Fig. 5. Photoionization plots showcasing the H2+ molecule, calculated with no symmetry (left) and with symmetry (right).

Fig. 6. Orbital plots of the LUMO orbital. Each sphere represents a section of “electron density”, where the orbital wavefunctions are defined.
Acknowledgments
This project was done as part of the NSF Research Experience for Undergraduates at Kansas State University. I would like to acknowledge the KSU staff responsible for the program (Kim Coy, Loren Greenman, and Bret Flanders) as well as my fellow undergraduate researchers. This material is based upon work supported by the National Science Foundation under Grant No. #2244539. Any opinions, findings, and conclusions or recommendations expressed in this material are those of the author(s) and do not necessarily reflect the views of the National Science Foundation. Computations for this project were performed on Beocat Research Cluster at Kansas State University, and used resources of the National Energy Research Scientific Computing Center (NERSC).
References
[1] S. Beaulieu, A. Ferré, R. Géneaux, R. Canonge, D. Descamps, B. Fabre, N. Fedorov, F. Légaré, S. Petit, T. Ruchon, V. Blanchet, Y. Mairesse, and B. Pons, New Journal of Physics 18, 102002 (2016).
[2] R. E. Goetz, C. P. Koch, and L. Greenman, Physical Review Letters 122, (2019).
[3] Z. Mašín, J. Benda, J. D. Gorfinkiel, A. G. Harvey, and J. Tennyson, Computer Physics Communications 249, 107092 (2020).
[4] P. Modak, L. Greenman, DAMOP Presentation (2024)
[5] S. Gozem, A. O. Gunina, T. Ichino, D. L. Osborn, J. F. Stanton, and A. I. Krylov, The Journal of Physical Chemistry Letters 6, 4532 (2015).
[6]A. Ammar, L. U. Ancarani, and A. Leclerc, Journal of Computational Chemistry 42, 2294 (2021).