Testing New Instrumentation for CMS Detector Upgrade and Development of Graphical User Interface
Wyatt Jones, Kansas State University, Physics Major
Mentored by Dr. Andrew Ivanov
Introduction and Methods
In 2008 one of the largest global scientific endeavors was created, the Large Hadron Collider. With more than five billion USD and contributions with twenty-three different countries. The LHC’s purpose is to unravel the mysteries of the universe, and asks questions like, what gives matter mass? What is dark energy? Why is there a disproportion of matter and anti-matter? What really happened during the big bang?
As eager as we are to answer all these questions, upgrades and continuous technological advancements are still required. In 2012, the discover of the Higgs boson pushed LHC to upgrade their detection process. What is known as the high luminosity LHC upgrade (HL-LHC) physicists around the world have made a stride to implement new technology into the LHC. This upgrade plans to increase the luminosity (the rate in which collisions occur in a given cross-sectional area) by a factor of ten.
My project was testing Compact Muon Solenoid (CMS) [Fig. 1] read out chips (CROC). The final chip version will be implemented into the CMS detector at LHC. The pixel chips are approximately 4cm2 in area and contain over 145 thousand pixels with each pixel 50x50um2 in size. The instrument used to test the CROC-V2 chips is a Sentio MPI-TS3000 [Fig. 2] wafer probe station. 136 chips are embedded on a silicon wafer for mass testing. Kansas State University is planning to test fifty-five wafers before sending them to Torino for additional testing. There are a variety of tests conducted on the chips, but the most important ones include pixel functionality, contact resistance, and proper chip communication.
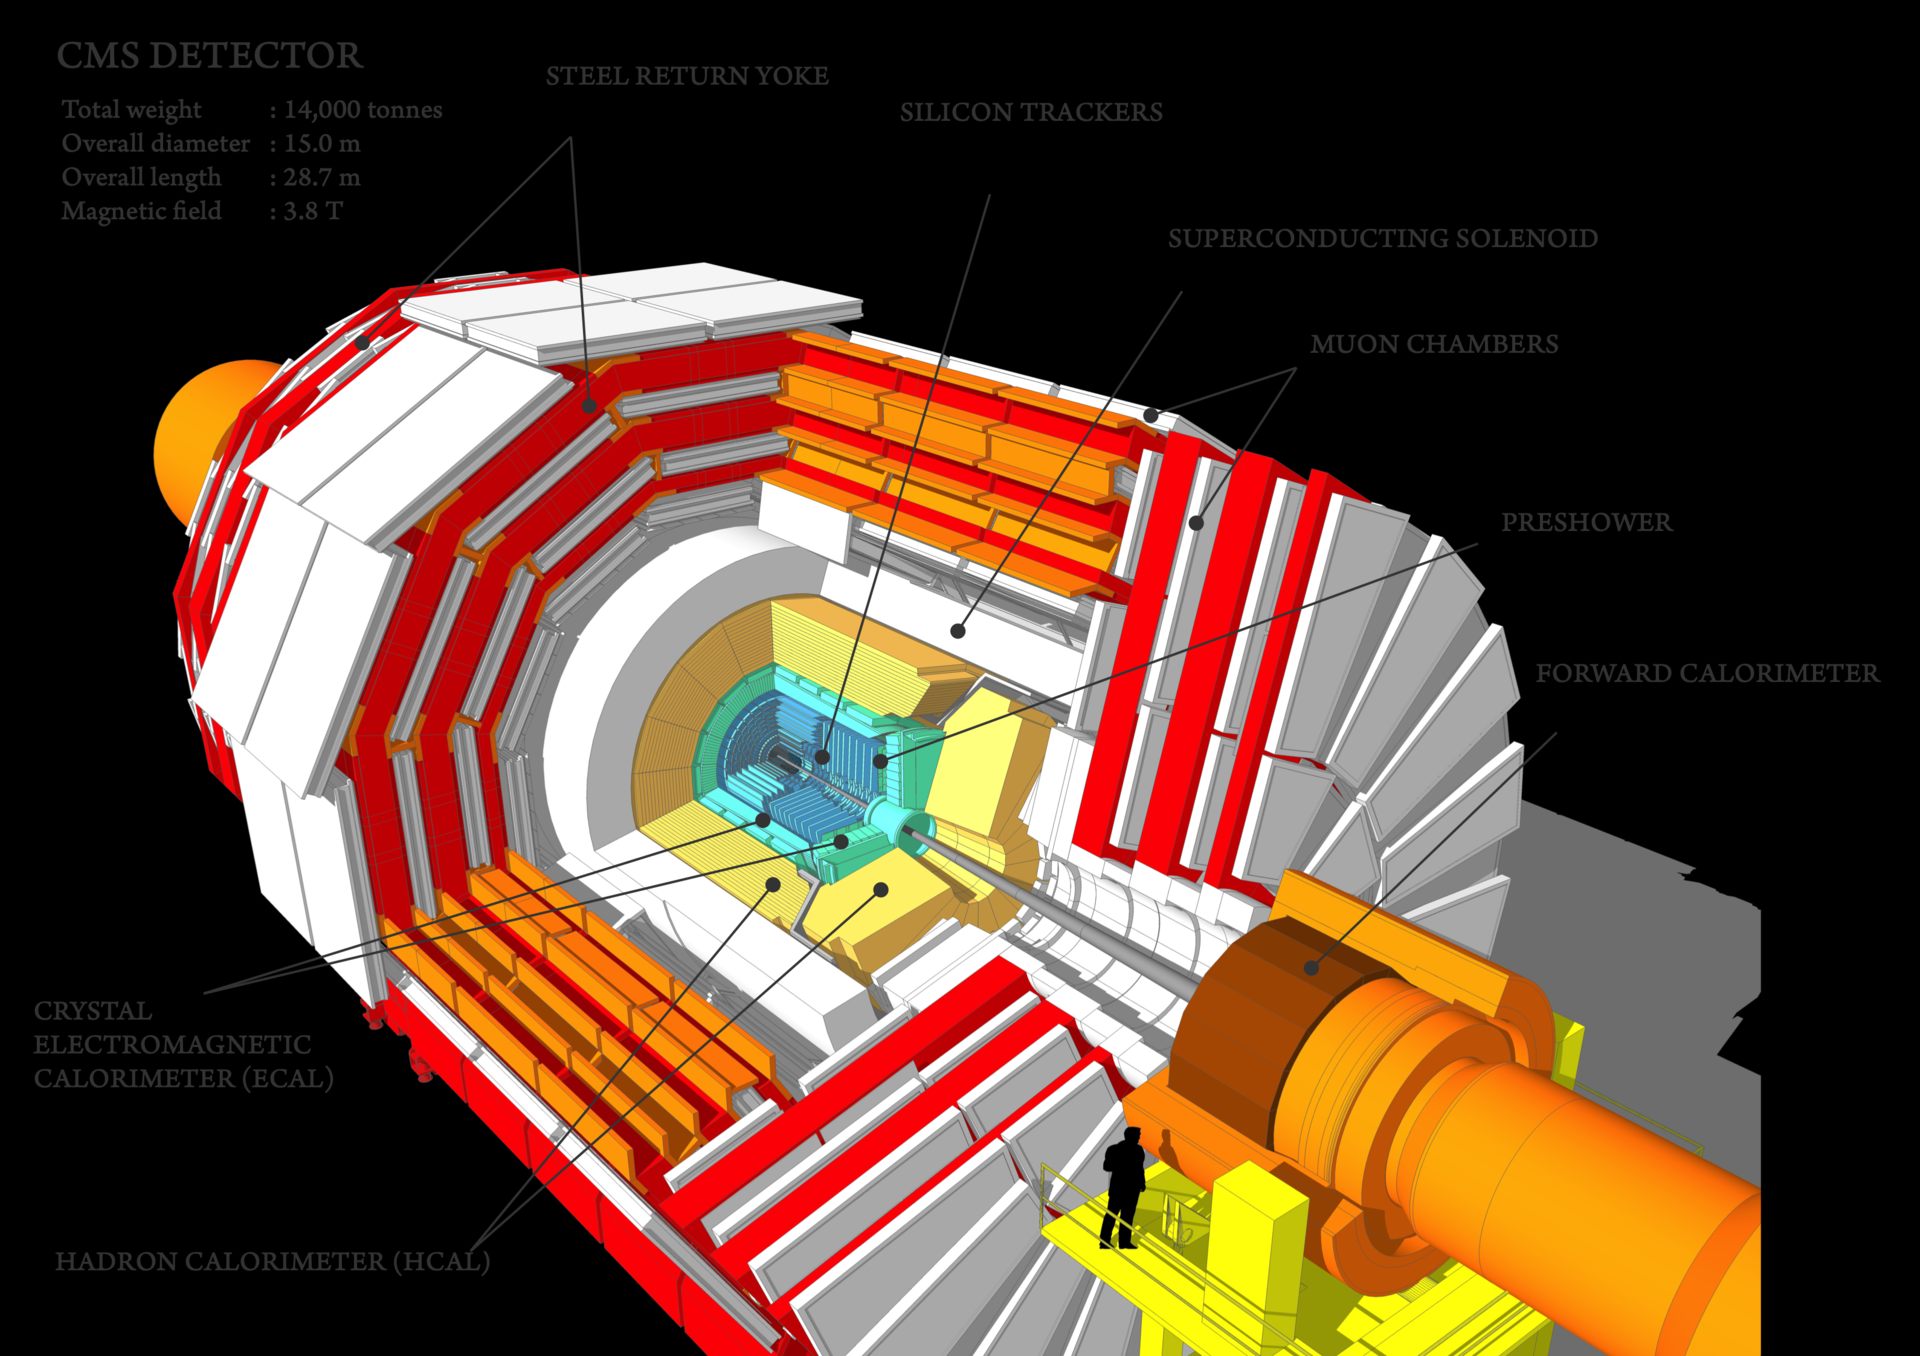
Fig. 1. Diagram of CMS detector
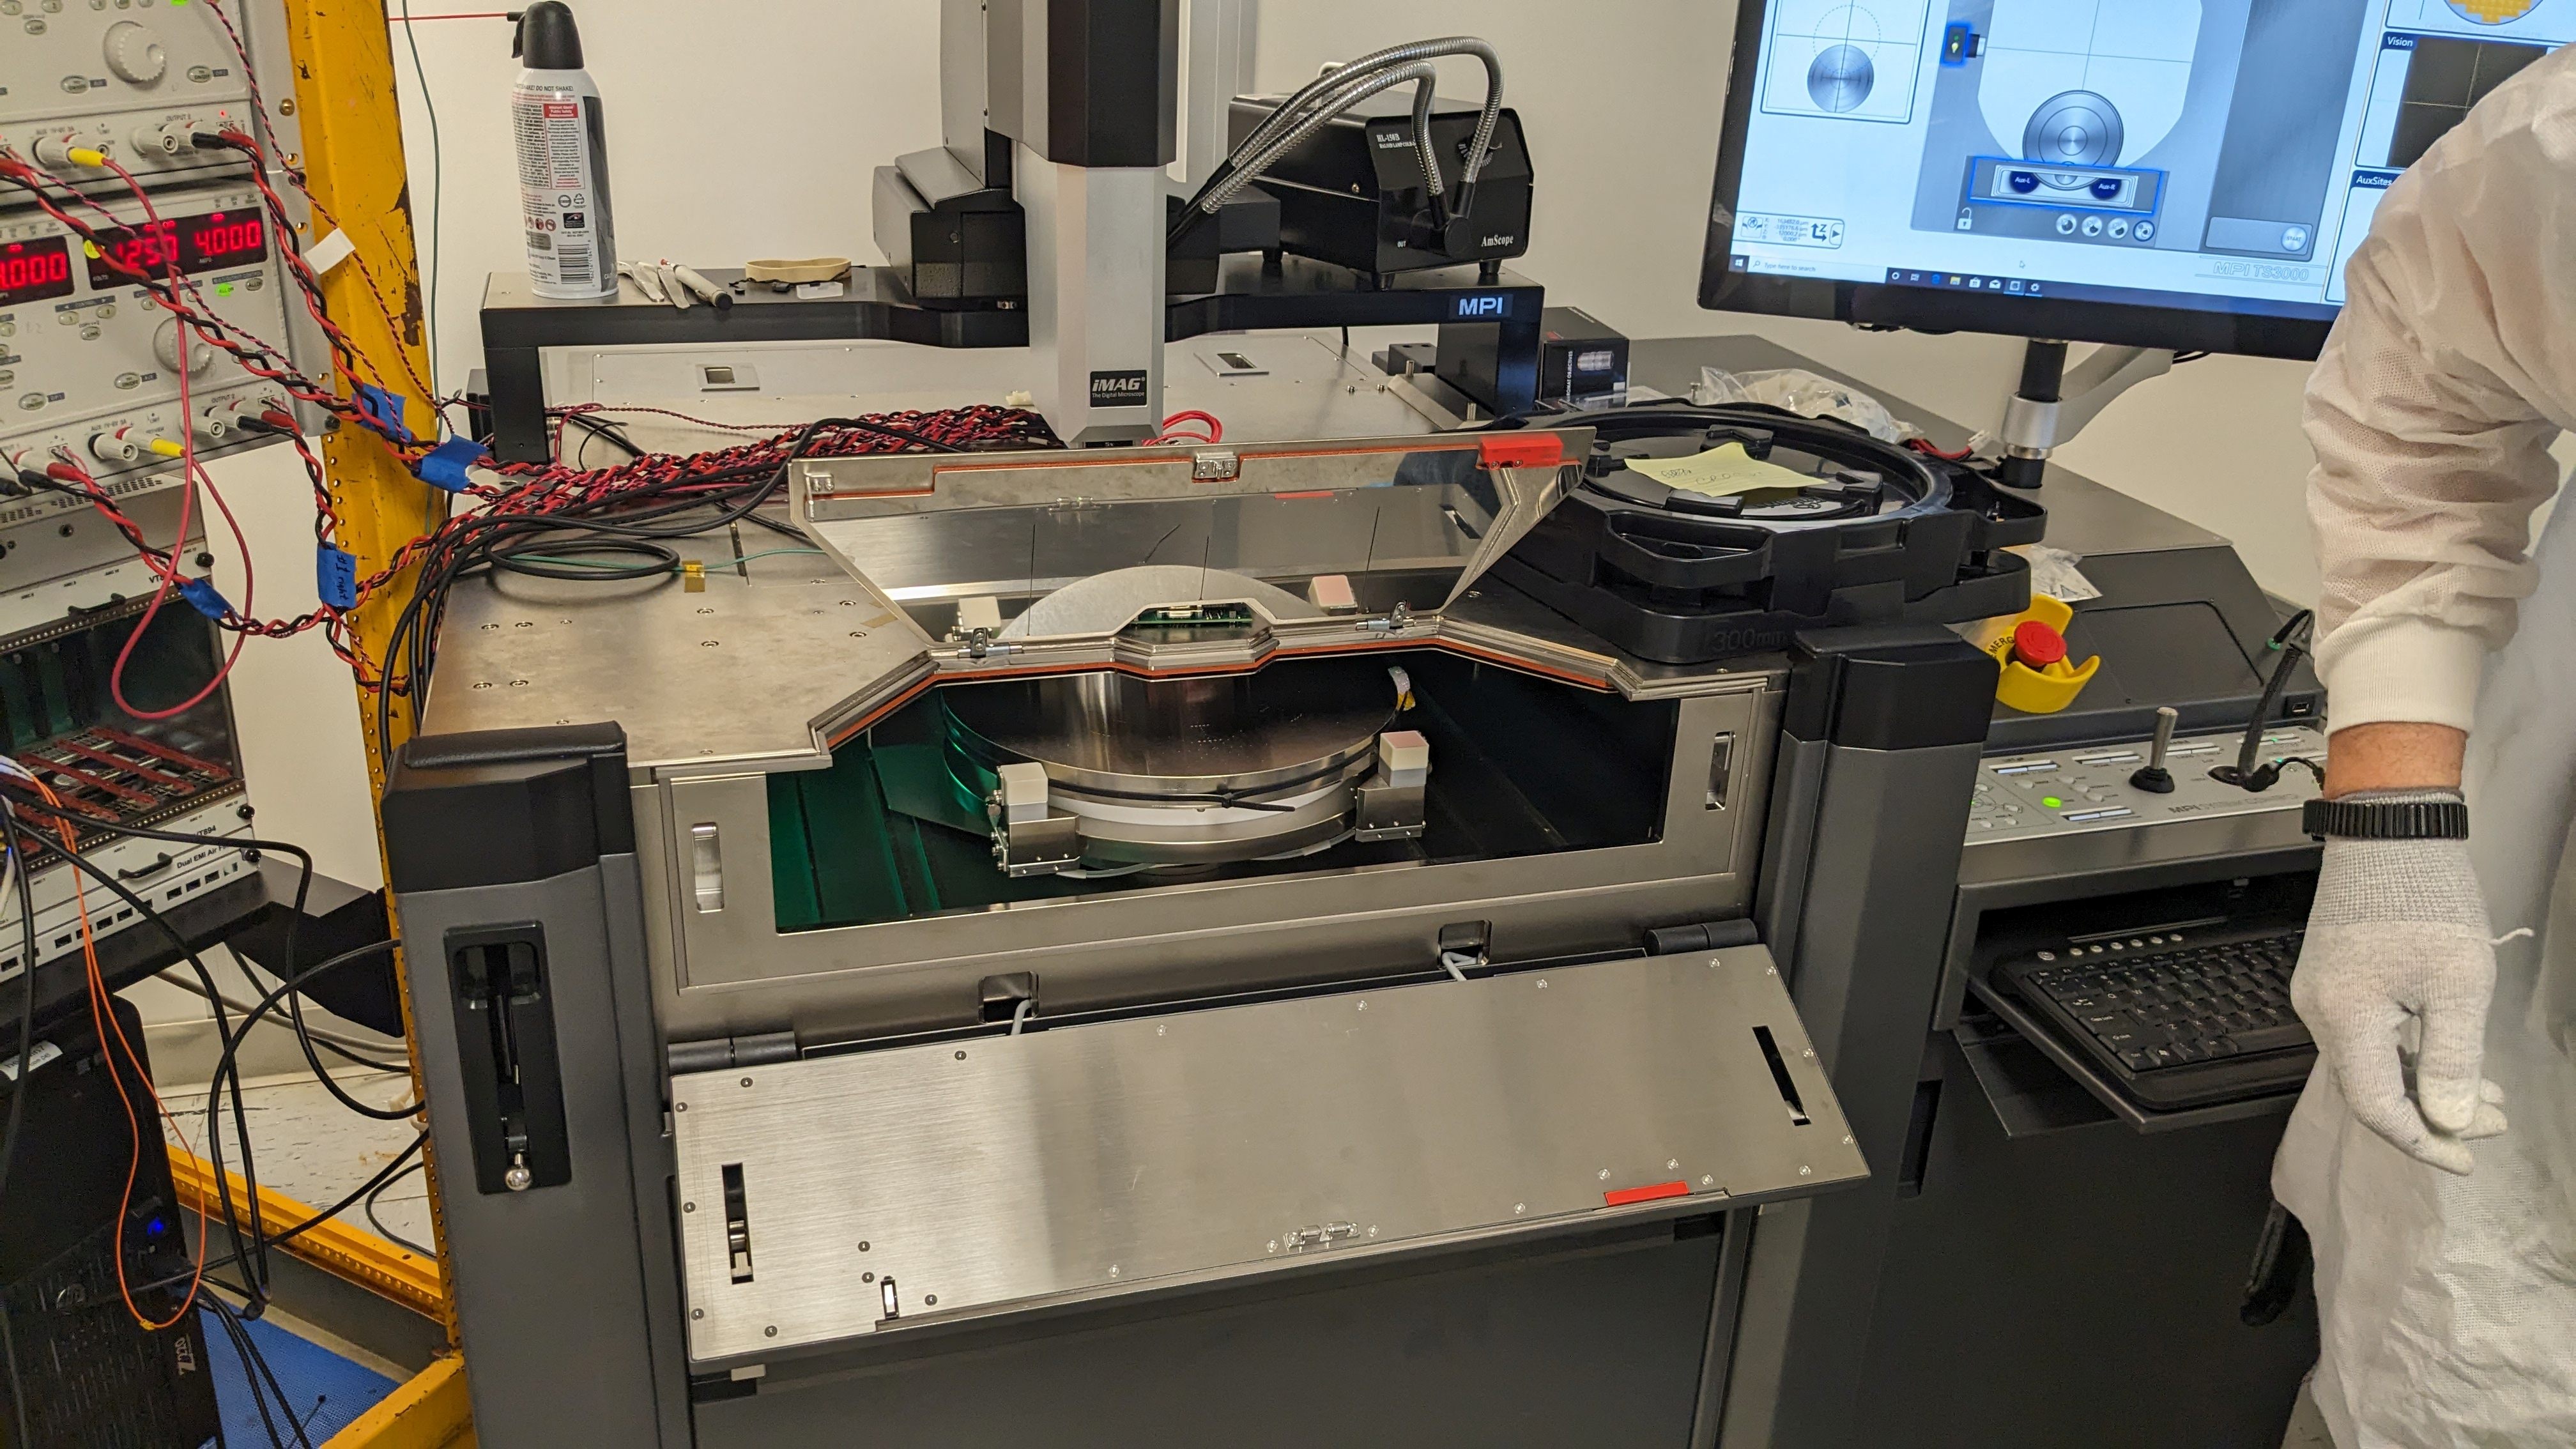
Fig. 2. Image of Sentio MPI-TS3000 Wafer Probe Station used for testing wafers
My contribution to this project is creating a graphical user interface (GUI) [Fig. 3] that will be used to run the wafer probe station, analyze and organize data. In early June our project was put on a hiatus due to hardware issues. While we’ve only tested nine out of the fifty-five wafers I plan to continue testing after the REU program is complete and implement Nat Penn’s work into my graphical user interface. Nat Penn is from Boston University and worked alongside this project to compile python programs to monitor testing and analyze errors that occurred throughout testing. While the GUI is still in early stages I plan to continue after the REU in updating the GUI.
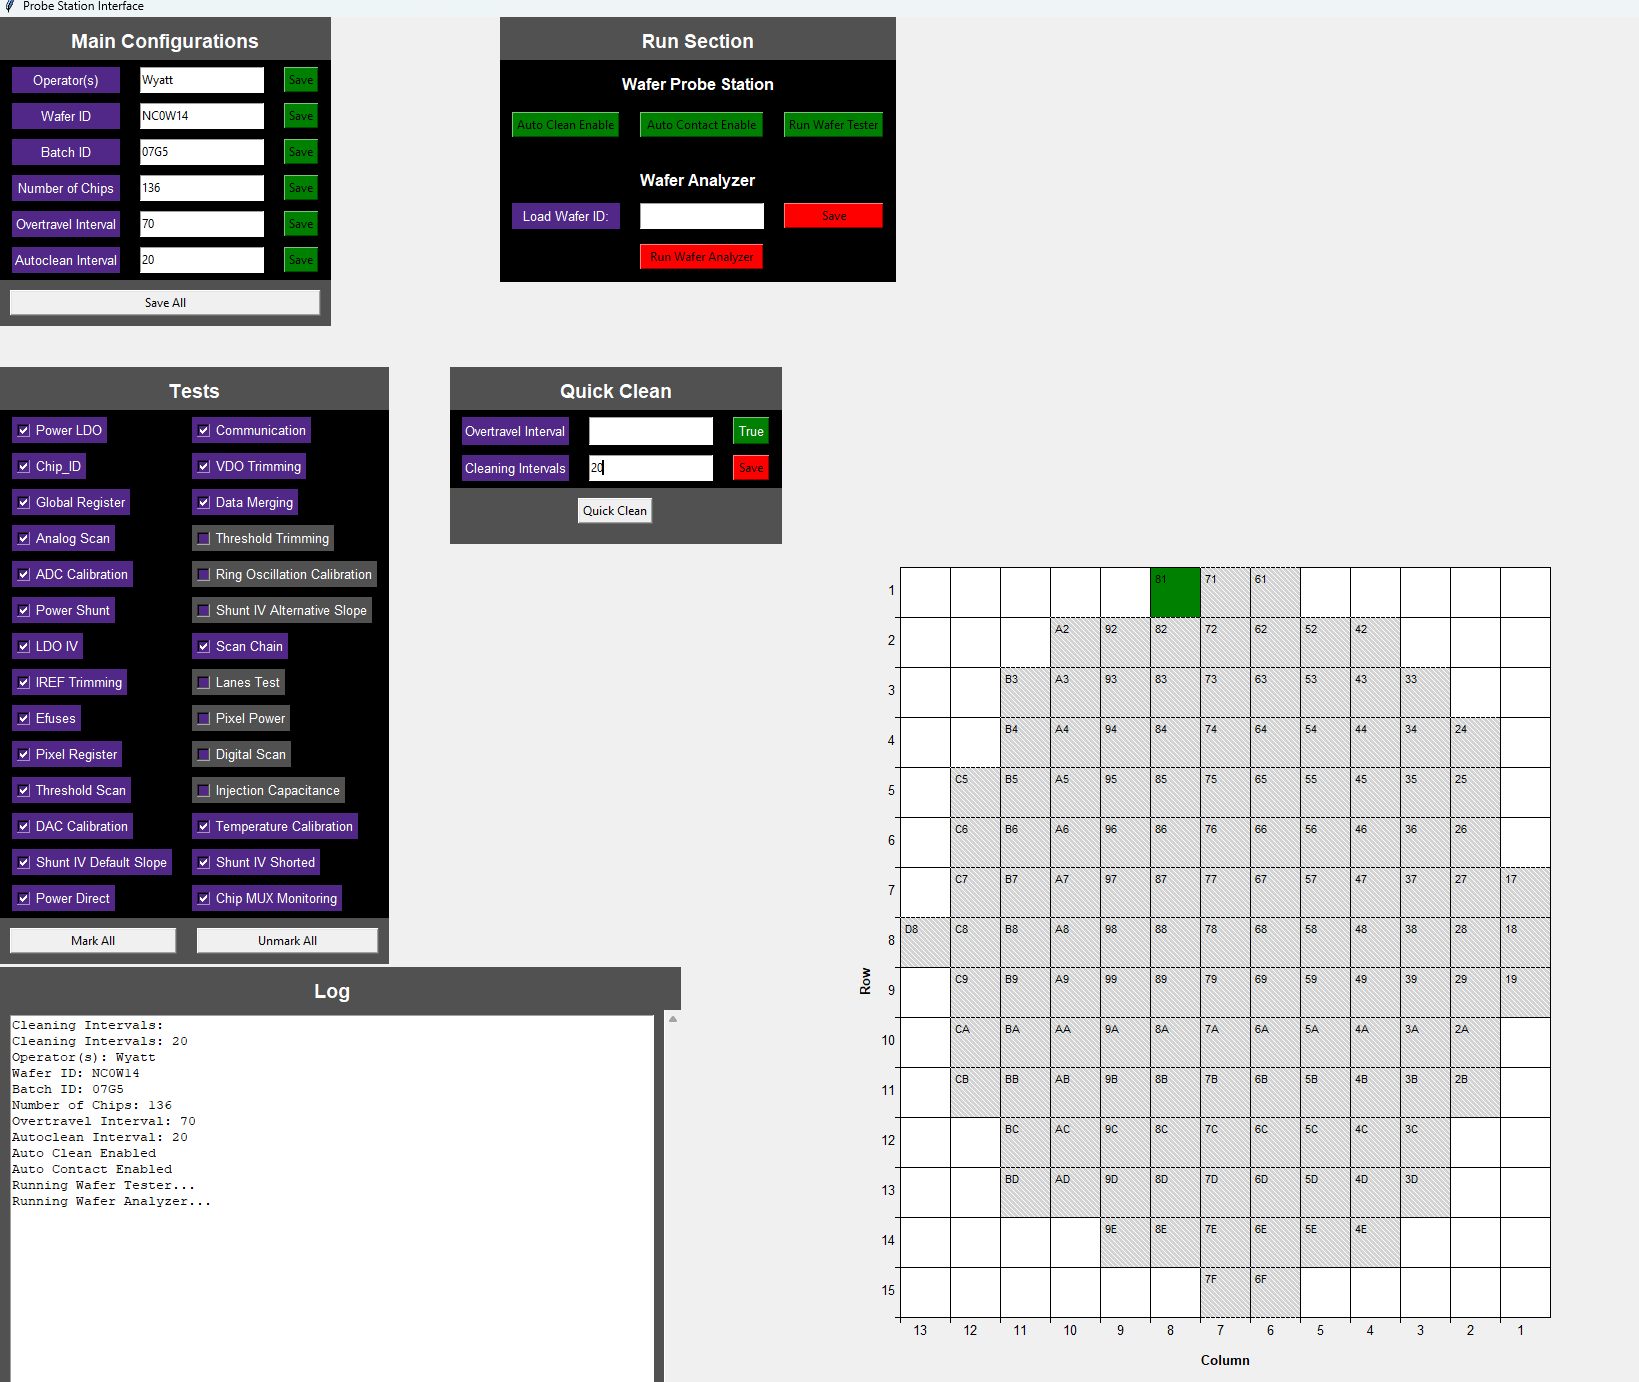
Fig. 3. Image of Graphical User Interface used to control the wafer probe station.
The data collected throughout the summer was limited due to a probe card breaking. However, after replacing the probe card upgrades were made that increased the chip yield (number of good chips) from 70% [Fig 4.] to just under 80% [Fig. 5].
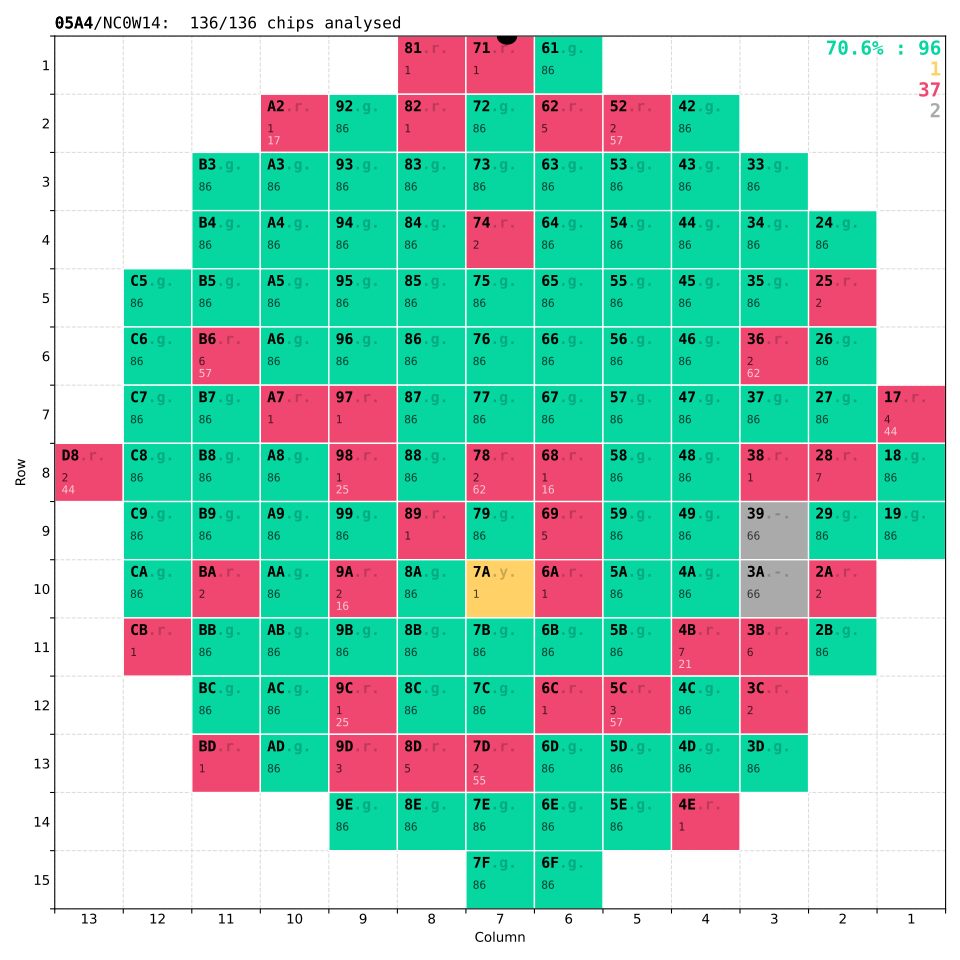
Fig. 4. Image of wafer map before software update (green chips passed, red chips failed, and gray were not tested). 70.6% success rate.
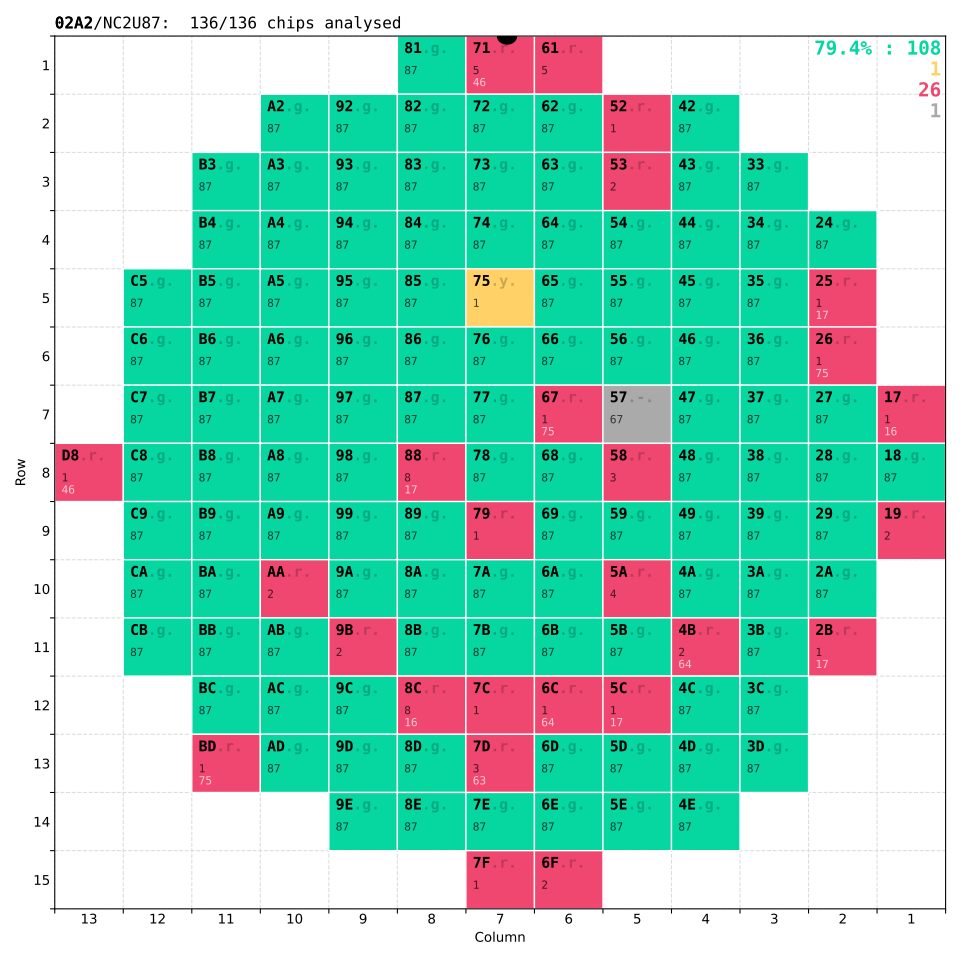
Fig. 5. Image of wafer map after software update (green chips passed, red chips failed, and gray were not tested). 79.4% success rate
Once the wafers are fully tested, they’ll be diced, and the thirty-thousand chips will be used to create the tracker layer of the CMS detector. The purpose of the tracker is to measure the curvature of particles as they travel through a magnetic field. With this curvature we can calculate the momentum of particles the particles. The tracker also allows physicists at LHC to measure background noise which can be used to calibrate the detector to minimize noise within the data.
Acknowledgments
I would like to thank Andrew Ivanov, Kim Coy, Loren Greenman, Bret Flanders, and James Laverty for running and mentoring us throughout the REU. I would like to thank Vinod Kumarappan and Chris Sorensen for their continuous support and guidance. I would like to acknowledge Jason Matteson, and Bruce Glymour for their ethics training. I'm also grateful for my colleague Nat Penn for their hard work, diligence, dedication, and brilliant insight. I must thank both Kansas State University and the NSF for funding and hosting this program. Lastly, I want to thank the REU students for their friendship and fond memories. This material is based upon work supported by the National Science Foundation under Grant No. 2244539. Any opinions, findings, and conclusions or recommendations expressed in this material are those of the author(s) and do not necessarily reflect the views of the National Science Foundation.
Final Presentation