Lana Chaleunrath-Pham, University of Mary Washington, Applied Physics Major
Mentored by Dr. Daniel Rolles and Dr. Artem Rudenko
This project is to blast triatomic molecules. Why do we want to blast them? We want to find their geometries, how the molecule is structured. We use a technique called Coulomb Explosion Imaging (CEI) to do this.
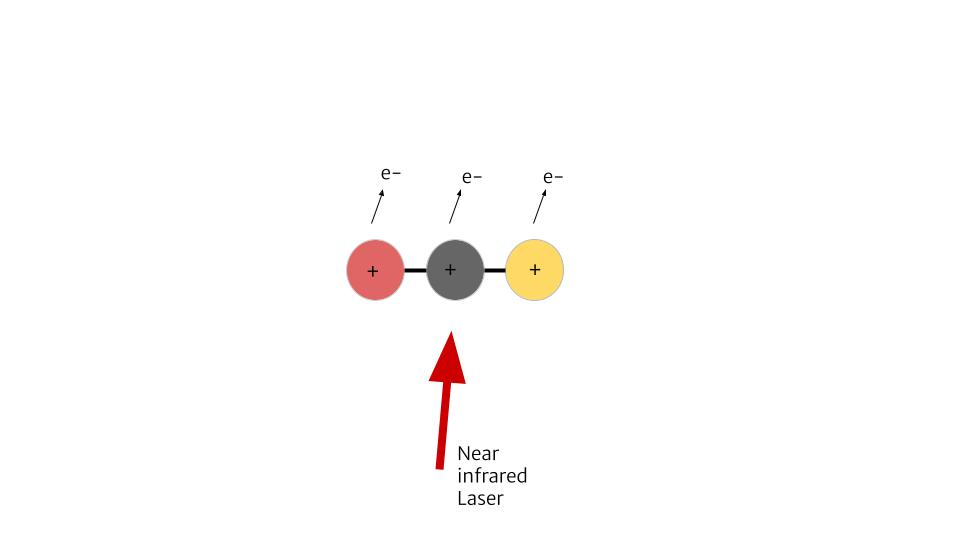
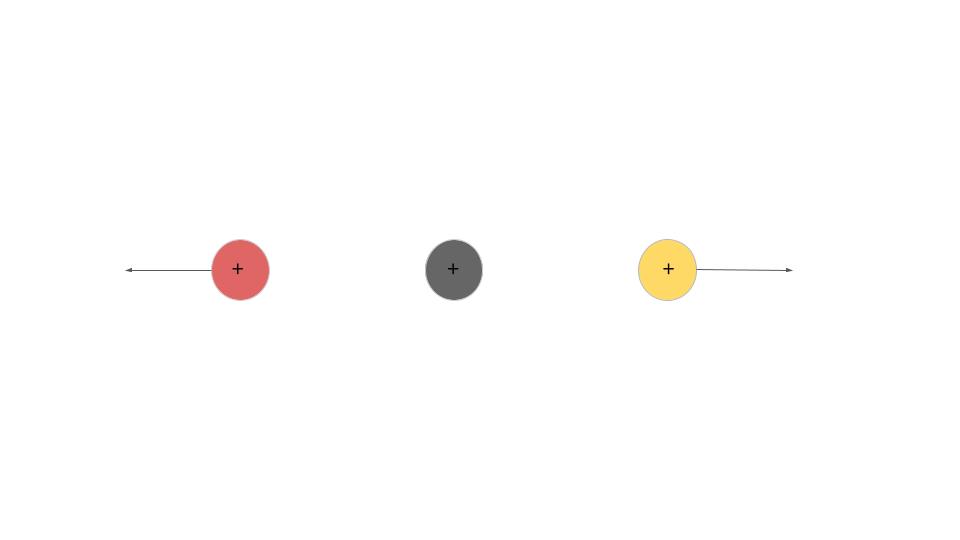
To explain how CEI works, we can look at an example of a molecule with 3 atoms, structured in a line. We can send a laser to it, and strip away some electrons. Say one electron removed from each atom. Now this ionized molecule is +3 positively charged. Since it’s unstable, it will blow up. The side atoms will fly away, leaving the center one.

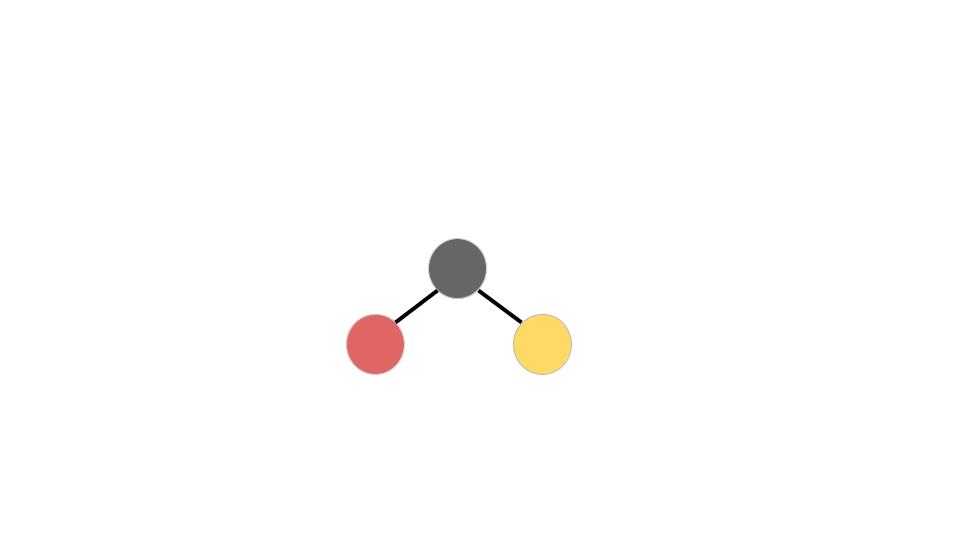
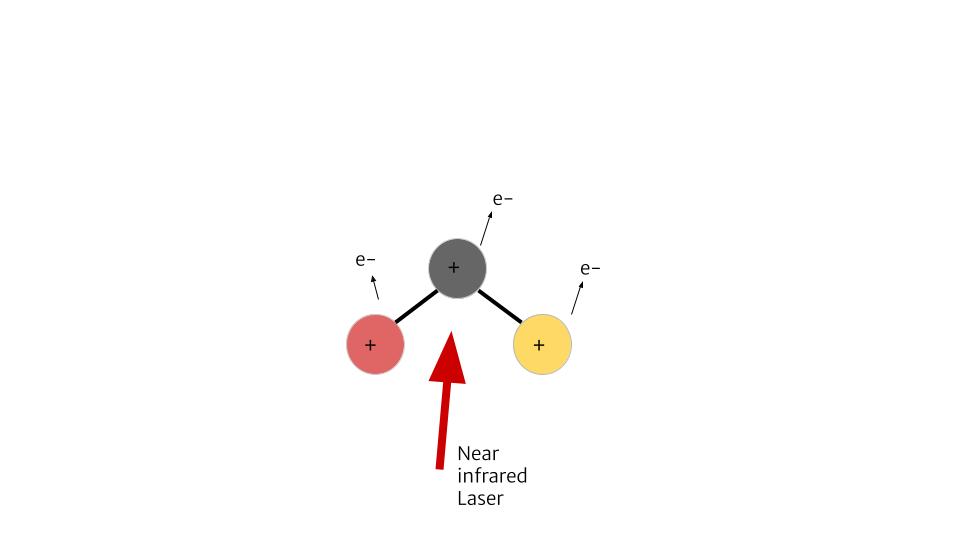
If the molecule originally has a bend, even the slightest one, all three atoms will fly apart. By knowing where these atoms/fragments fly, we can find out if the molecule was originally linear or bent. We could also know how it was orientated and the angle between the atoms.
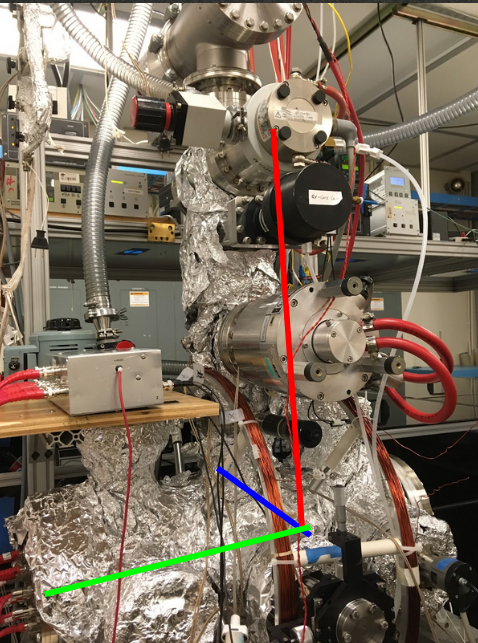
This project is largely experimental. We use the COLTRIMS (Cold Target Recoil Ion Momentum Spectrometer) set up in the James R Macdonald Lab. In this set up, our molecules are being shot down by a gas jet into a spectrometer. A laser comes in and ionizes it, causing the molecule to break apart into fragments. Those fragments will be pulled by the spectrometer’s electric field towards a detector at one end. From this detector we can identify the position that the fragment hits, and the time it takes for the fragments to reach there.
In this summer project, we’re looking at changing some settings of the method used. We’re changing the pulse duration (short 28fs or long 5fs) and the laser power (low 125mW or high 250mW). We’re wondering if these four settings will change coulomb explosion patterns. Or even, will we be able to reconstruct the geometries using CEI?
We looked at Carbonyl Sulfide (OCS) molecules. Following is the raw data and some analysis on OCS data under [250mW, 28fs] and [250mW, 56fs].
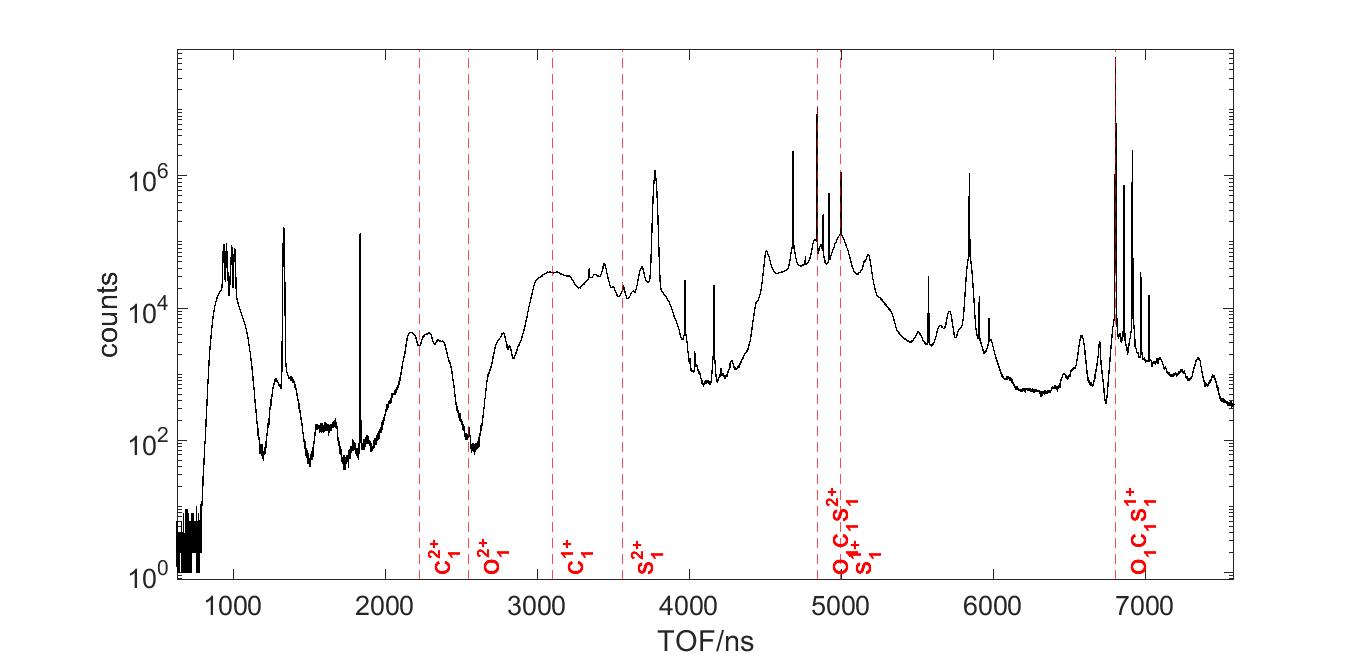
A time of flight (TOF) graph is found from the detector. Each spike are clusters of different ion fragments, such as C+, O+, or S+. We can figure out which spike is what based on the ion’s charge and mass. Notice how the Y axis is in log scale. In linear scale, the only spike that we’d be able to see is OCS+ and OCS++.
The other thing that the detector records is the positions of these fragments. With this and the TOF, we’re able to find the velocities of these fragments. And when knowing the mass, we can take it a step further and find the momenta.
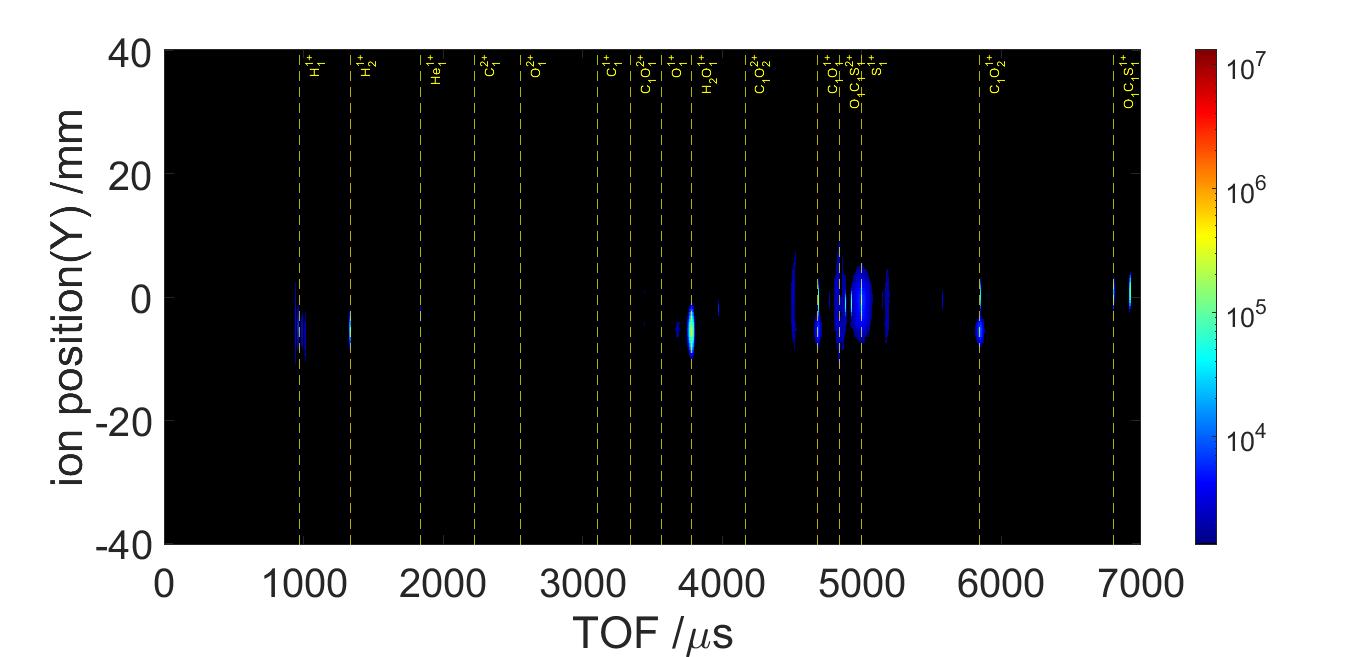
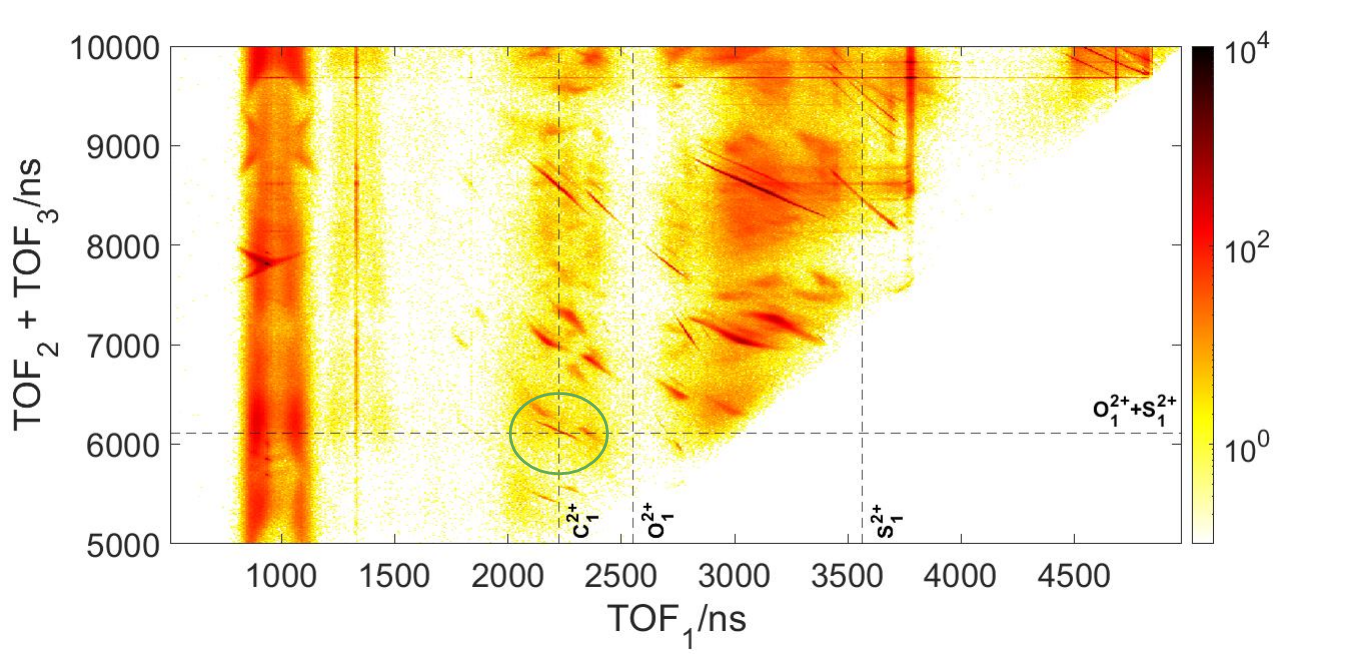
Looking at a Three Body plot, we can identify a specific three-body fragmentation channel. Fig 10 highlights the C2+, O2+, S2+ coincidence channel. It’s separated from other channels and can give a clear indication of the geometry before fragmentation. This coincidence channel is +6 positively charged, and is more likely to blow apart all at the same time.
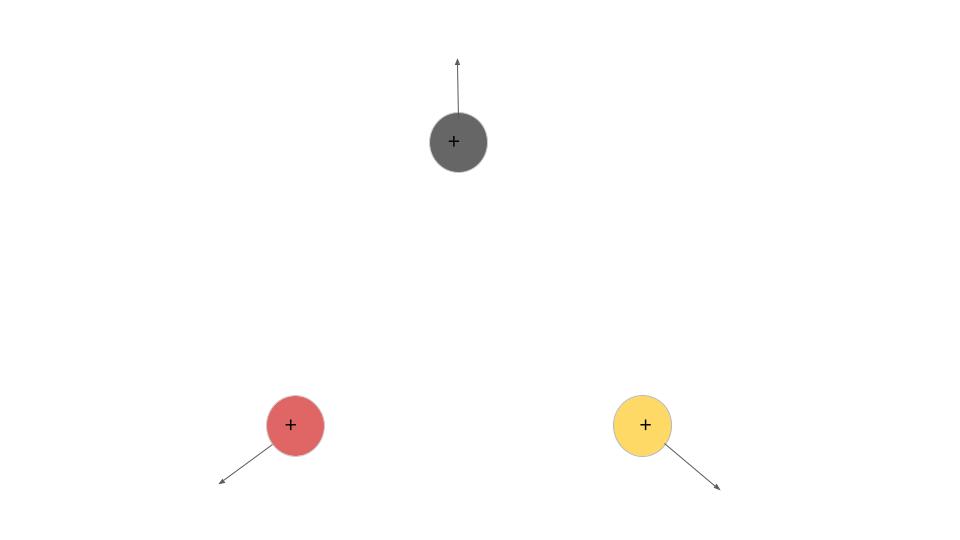
The results from the data analysis gives us Newton Plots (Fig 11 and 12). These plots visualizes the momentum correlations between each fragment. In both graphs, the S2+ ion momenta has been normalized to 1 in the x direction (indicated by the arrow). C2+ momenta points upwards and O2+ momenta points downwards relative to S2+. The counts are lower on the 56fs graph since the intensity is half. The intensity is linear with the product of the power and pulse duration. Since we kept the power the same and doubled the pulse duration, the intensity went down.
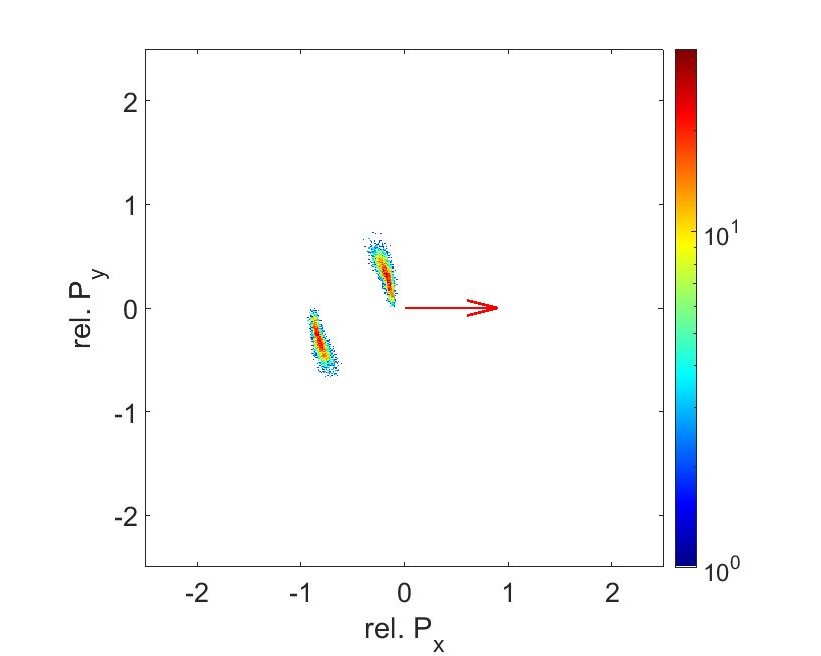
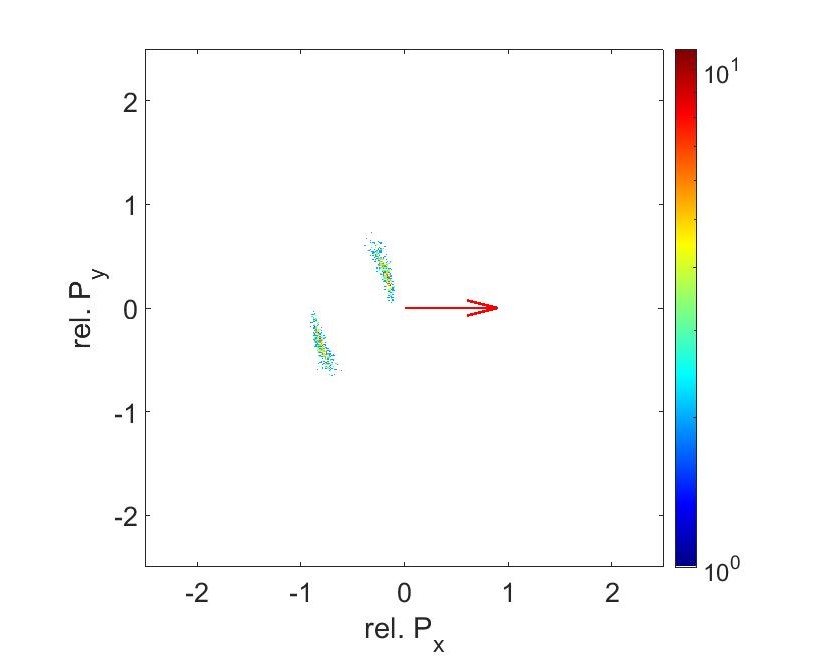 Fig 12: Newton plot for C2+, O2+, S2+ at 250mW and 56fs
Compare the previous newton plots with the plots from a C+ O+ and S+ coincidence channel. These semi circle shapes are created when bond breakups aren’t occurring at the same time. The bond between C and S can break first, pushing the fragment of OC away in an arc pattern, then having that C and O break up later. Because these bonds aren’t occurring at the same time, we can’t use this to reconstruct the molecular geometries. But we do see that the shape between the 28fs and the 56fs are the same, showing that pulse duration isn’t super critical to finding the geometries.
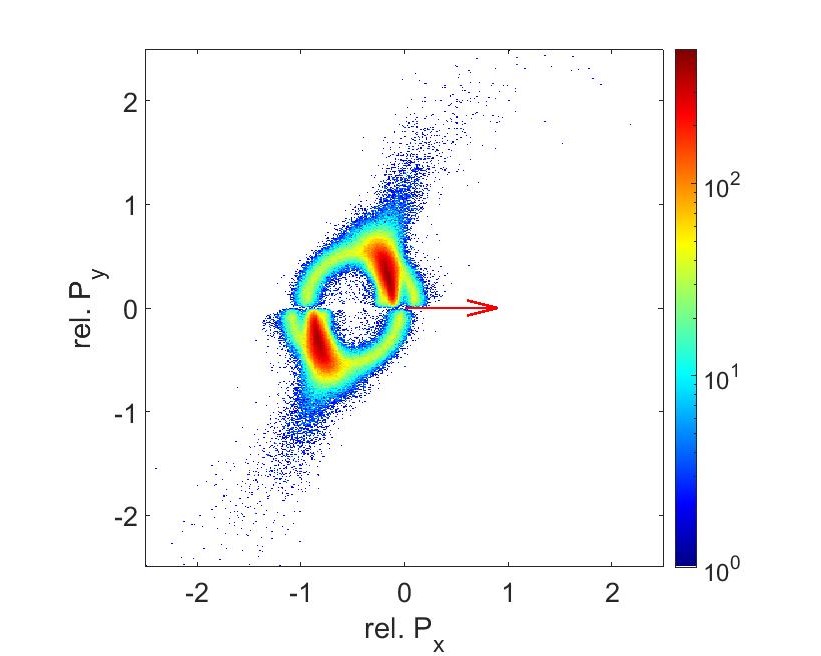
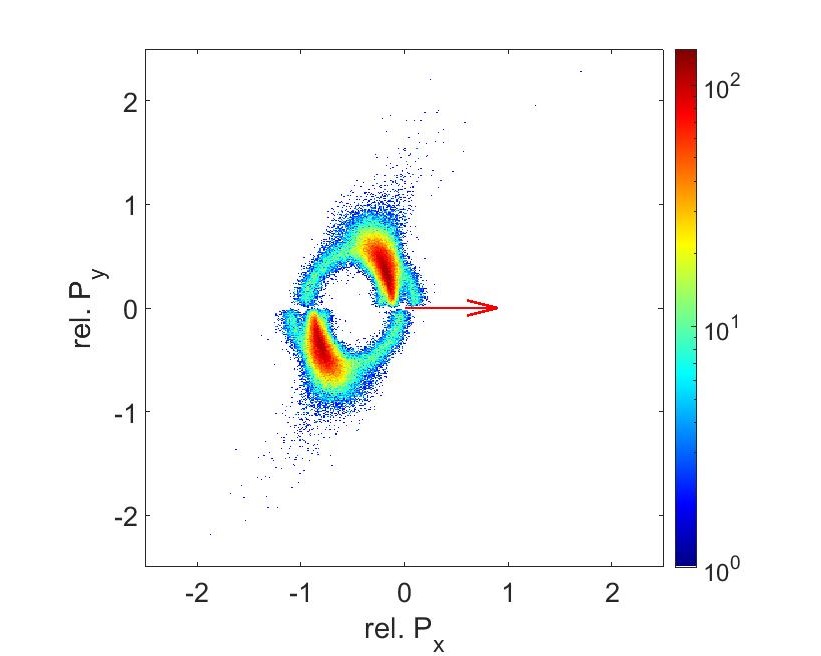 Fig 14: Newton plot for C+, O+, S+ at 250mW and 56fs
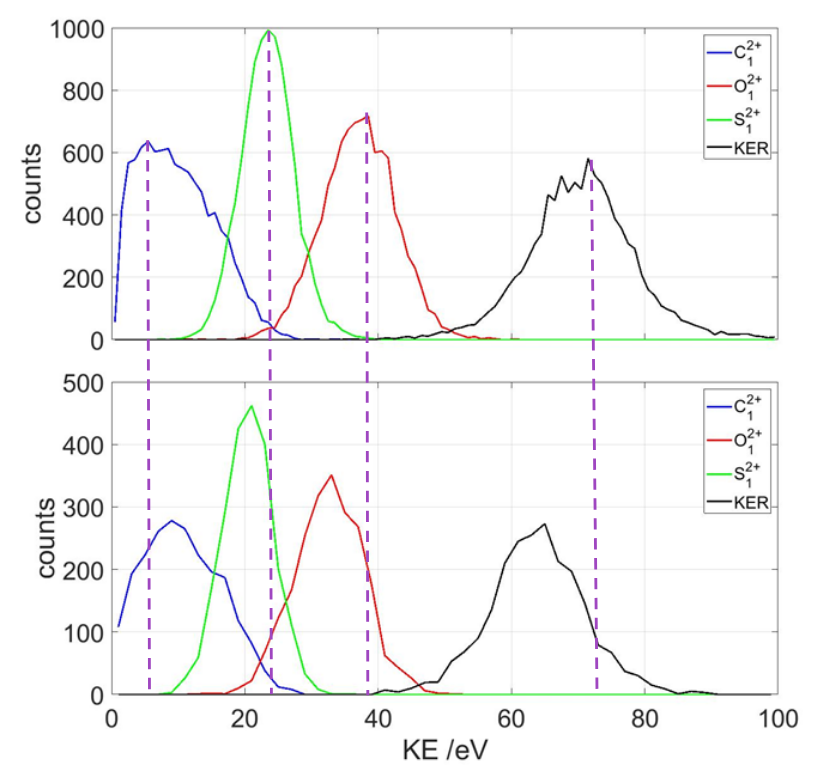
The kinetic energy release (KER) of the three ions are also calculated from the TOF and detector hit positions. Comparing the two graphs, we see that the longer pulse duration has consistently lower energy release than the shorter pulse. This is because when the molecule becomes ionized, in a longer pulse, it has time to reach a +3 charge state and start blowing up before reaching a +6 charge and actually breaking bonds. The breakup in 28fs occurs more instantaneously, releasing more energy.
The end results of this summer project are the newton plots shown above. Though they don’t show the exact distance between each atom, they’re sufficient in showing how the molecule breaks up. More data analysis is required to see how the different laser power would have changed coulomb explosion patterns.
Acknowledgments
The people at K-State really curated this open environment, and for that, this summer will forever stick with me. I’d like to thank Dr. Daniel Rolles and Dr. Artem Rudenko for being my advisors on this project. I would also like to thank my mentors Keyu Chen, Surjendu Bhattacharyya, and Anton Khmelnitskiy for being there for my many questions. And of course, many thanks to Kim Coy, Bret Flanders, and Loren Greenman for organizing this REU program, as well as Kansas State University and the National Science Foundation for funding the program.