
Motivation, Methodology, Data, and Results
Our research involves the area of physics known as plasmonics, which studies the effects of collective charge oscillations that occur between the interface of conductors (in our case, gold nanoparticles) and dielectrics (the solution surrounding the particles). The following is a description of our reasons for pursuing this area of research, the theory behind plasmonics, how Faraday rotation works, and how it all applies to our research.
Motivation
The reason we are studying gold nanoparticles in particular is because metallic elements exhibit and enhanced Faraday rotation signal. This is partly due to the delocalization of the metal's electrons; when excited by electromagnetic radiation, these electrons behave as a plasma and then they are excited resonantly, the absorb more light. We hope to observe how the Faraday rotation signal changes when we alter the size and concentration of the nanoparticles, as well as determining the Verdent constant of gold. The Verdet constant is a wavelength-dependent function unique for every dielectric medium.
Plasmonics
A well-known property of metallic elements is the delocalization of their outermost, conductive electrons. These electrons are not bound to single atoms, but rather orbit around the entire metal bulk as a "cloud". Because of this quasi-gaseous state of the electrons, the cloud is essentially a plasma--the so-called "fourth state of matter". In this state, electrons are separated from their nuclei and in turn, the electrons act as a freely-moving gas of charge-carriers which can be excited by electromagnetic radiation to create propagating plasma waves. One quanta (the smallest, discreet unit of energy) of these plamsa waves is known as a plasmon.
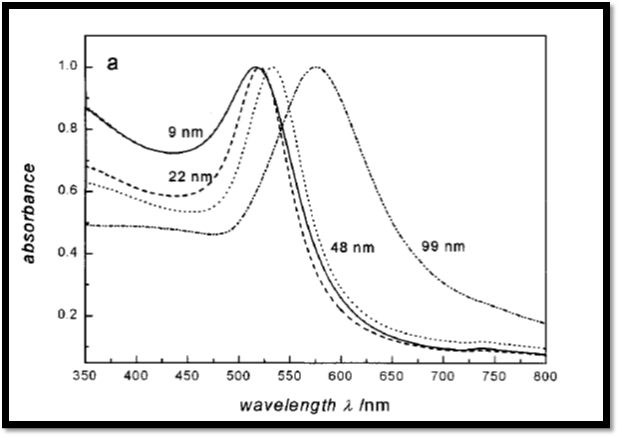
When excited resonantly, these plasma waves exhibit a great deal of absorption and these peaks, as shown in the image above, are known as plasmon peaks.
Faraday Rotation
In short, Faraday rotation is the change in the polarization of an electromagnetic wave as it propagates through some medium parallel to the axis of a magnetic field. To understand Faraday rotation, it's easiest to imagine linearly polarized light as a superposition of two circularly polarized vectors, one travelling clockwise and the other travelling counter-clockwise. If these vectors are equal in magnitude and phase, the resultant vector is a linearly polarized beam of light.
Faraday rotation occurs when there is a phase difference between these vectors. Specifically, when these vectors encounter what is called a birefringent material (a material that has different indices of refraction for different direction of propogation, thus slowing down the light more in direction than the other) there is a net displacement in the vectors and we see a rotation in the plane of polarization.
Data
Our research was based almost entirely on three pieces of data that we collected. First is the spectral data under two condition: one is a spectral shot of the light pulse passing through our sample in the absence of the magnetic field while the other is induced by the magnetic field. This data corresponds to the top box shown in the image seen here.
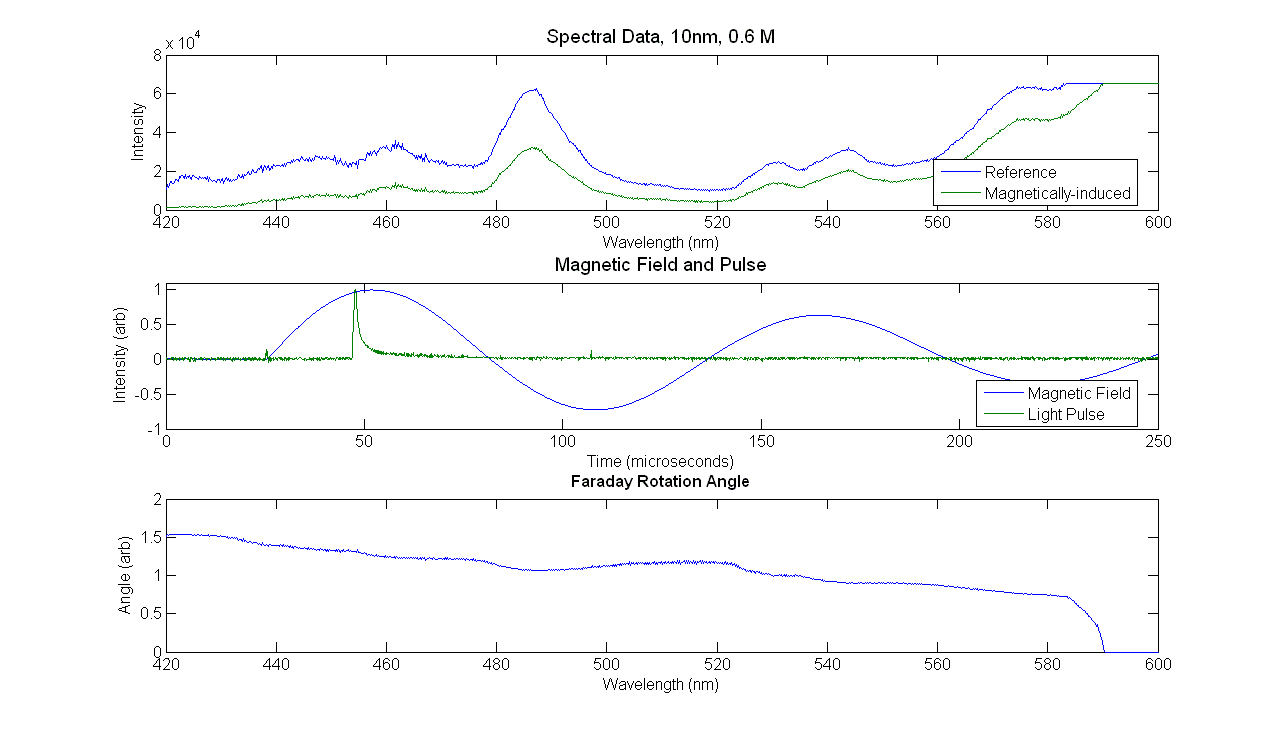
The second piece of data we collected is the magnetic field signal, which needless to say, shows us the magnitude of the magnetic field. Since we used a 6,000V capacitor and passed that huge current through a solenoid, we were able to achieve a magnetic field of about 2-3 Teslas. For reference, the magnetic field on the surface of Earth is about one-millionth the strength of ours. This data corresponds to the blue sinusoidal wave shown in the second box. The final data we collected was the magnitude of light pulse. However, we are not so much interested in the magnitude of the pulse but rather where that light pulse hit with respect to the magnetic field. This way, we can calculate the relative magnetic field strength and analyze that data to see how the Faraday rotation signal changes with a changing magnetic field.
The third box shows us the actual Faraday rotation signal which was calculated using Malus's Law of polarizers, which says that the intensity of light passing through a polarizer is equal to the initial intensity times the cosine of the angle squared. This signal is different depending on the size of the nanoparticles used, the concentration of the solution, and the strength of the magnetic field.
Results
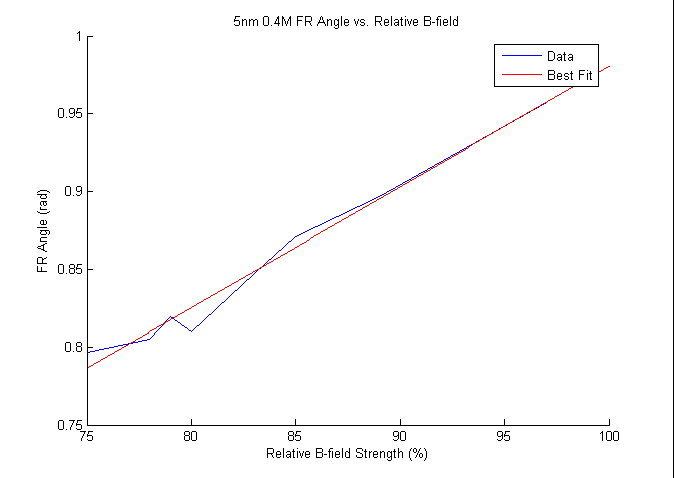
Our data shows several trends in the Faraday rotation signal. The first of which involves how the signal was affected for various magnetic field strengths. As you can see from this figure, with increasing magnetic fields, the Faraday rotation signal increases. This trend was found for all sizes and concentration of nanoparticles, although this relationship was unclear for magnetic field strengths of about 40% and below.
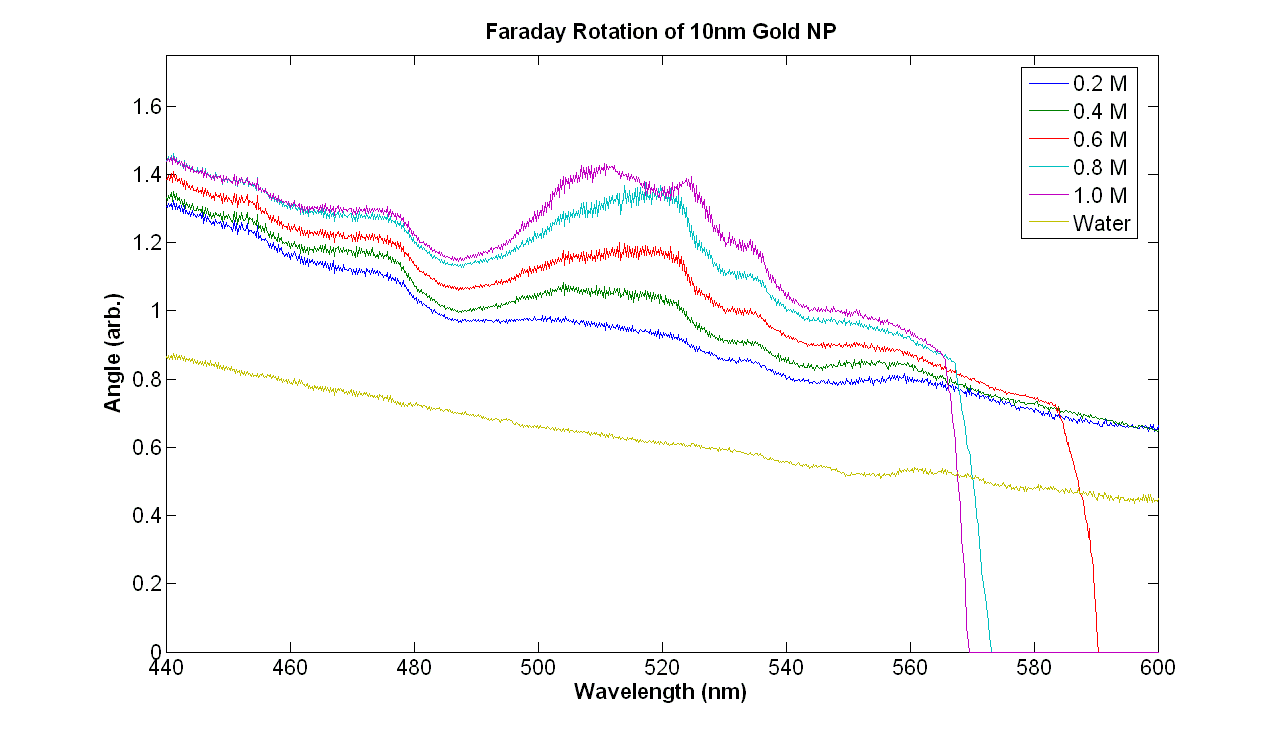
Our data also shows that for increasing concentration of nanoparticles, the Faraday rotation signal increases. We can see this relationship in this figure, where each color represents a different concentration, ranging from 0.2 M to 1.0 M. The trend is obvious; for increasing concentrations, we have increasing Faraday rotation signal.
Conclusions
Based on our data, we can make several conclusions. First, Faraday rotation signal is concentration-dependent. With higher concentrations of nanoparticles, we see higher angles of rotation. Second, Faraday rotation is also dependent on the size of the nanoparticles. Bigger sizes of nanoparticles show an increase in signal, but there is a limit. We see that as we go higher than 40nm, the Faraday rotation becomes unclear, probably because there is light lost from scattering instead of just the plasmon peaks. Lastly, there is a linear relationship between the Faraday rotation signal and the relative strength of the magnetic field.
To view my final PowerPoint presentation containing all of this data and more, please click here.