Characterizing a Parallel Plate Imaging Deflector
Anjali Filinovich, Southern Adventist University, Physics Major
Mentored by Dr. Itzik Ben-Itzhak and Dr. Chandan Bagdia
Overview
This experimental research group seeks to understand laser-molecular ion interactions using momentum imaging techniques. When an ultrafast laser pulse interacts with a beam of molecular ions, these ions fragment through various processes. In our imaging setup (Figure 1), these fragments are separated in time by the field of a spectrometer (far left), which accelerates ions in the forward direction of the beam. Then, the fragments are separated in space by an imaging deflector, which deflects each charged fragment in the x-direction. The separated fragments hit one of the two position- and time-sensitive detectors (far right), where position and time of flight data is recorded.
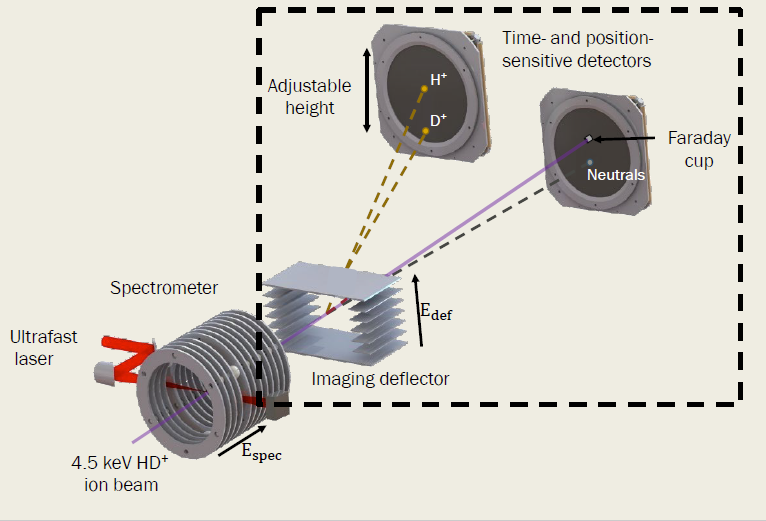 Fig. 1 Schematic of momentum imaging setup (not to scale)
Unfortunately, the electric field of the parallel plate imaging deflector distorts the position and time of flight data. The fringe fields causing these distortions are pictured in Figure 2, where the field lines are curved.
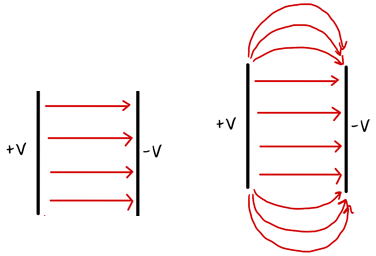 Fig. 2. Schematic of the ideal (left) and real (rightparallel-plate deflector fields
The goal of this REU project has been to characterize the electric field of the parallel plate deflector to enable the recovery of the momentum of the fragments . To do so , we used a software called Simion to simulate the ion trajectories, which is reflective of experimental data. We then compared this simulated data to an analytical model based on the ideal parallel plate deflector field, which we called the virtual deflector. The x deflection of the virtual deflector was initially described by the following equation (x is the direction of deflection):
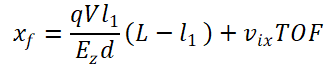 where xf represents the final x-position recorded on the detector, V is the voltage on the deflector plates, q is the fragment’s charge, Ez=mviz2 is its kinetic energy along the direction of the beam, vix is the dissociation velocity in the x-direction, TOF is time of flight to the detector, and all other parameters pertaining to the imaging setup are described in Figure 3.
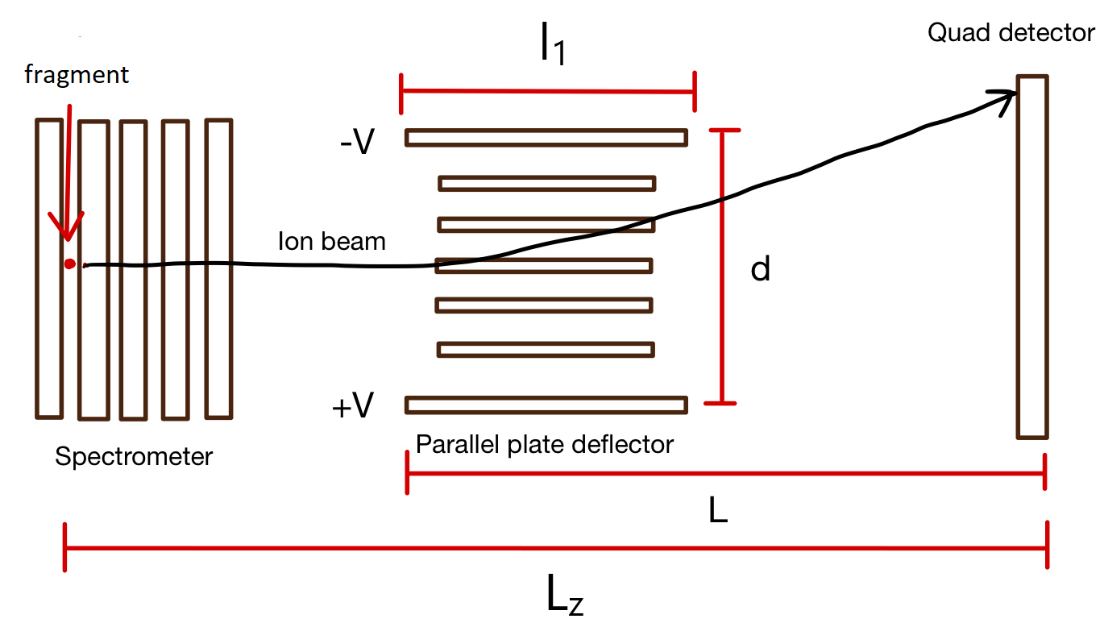
Fig. 3. A labeled schematic of our imaging setup
According to the above equation, the deflection in the x-direction is proportional to qV/E. Equations for the dissociation velocity of the fragments can be derived from measured quantities and geometrical parameters of the imaging setup.
The virtual deflector equations were fit to simulated data, enabling the determination of position and time of flight without distortions.
Correcting the x-position model
In the x-direction, the xf virtual deflector equation was modified by adding terms up to the second order of vix to match this equation to the simulation results. The simulated data and virtual deflector model before correction are shown in the left-hand graph of Figure 4. The corrected virtual deflector xf equation is as follows:

where the correction term is ![]() . The effect of this correction is pictured in Figure 4 (middle), where the corrected virtual deflector results are compared with Simion’s results. The residual difference between the two is graphed on the right and is less than the 0.25 mm position resolution of our setup.
. The effect of this correction is pictured in Figure 4 (middle), where the corrected virtual deflector results are compared with Simion’s results. The residual difference between the two is graphed on the right and is less than the 0.25 mm position resolution of our setup.
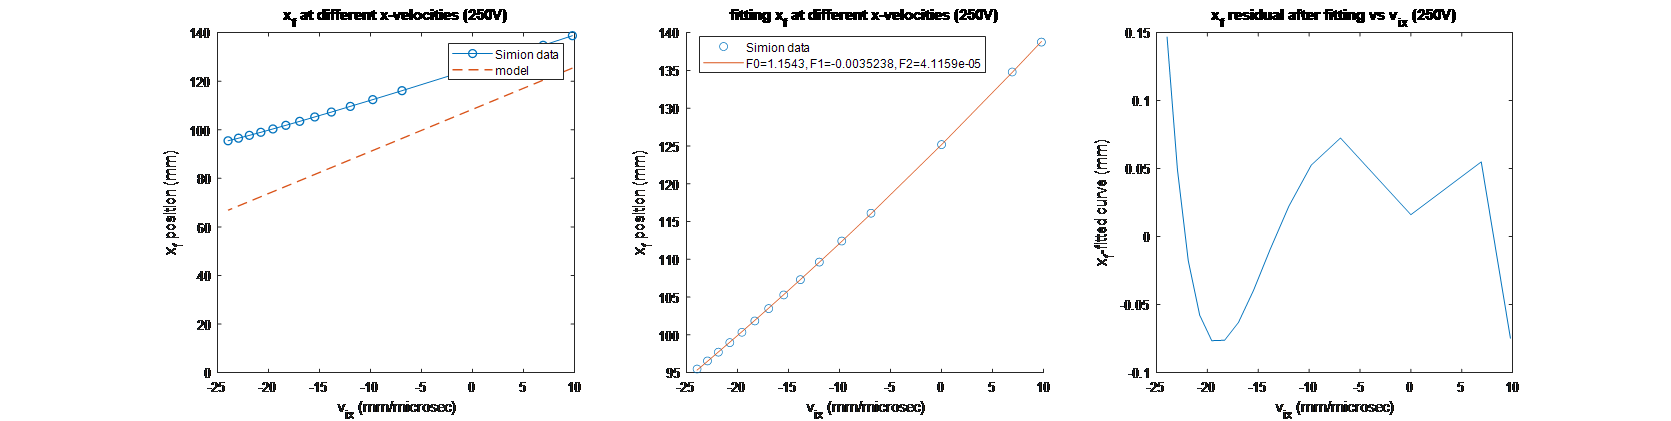 Fig. 4 Model and simulation comparison, fitting, and residual graphs
In Figure 5, we graph the correction coefficients, F0, F1, and F2 for different initial fragment conditions, summarized by Escl, which is defined as

where ![]() , the initial kinetic energy in the direction of the beam.
, the initial kinetic energy in the direction of the beam.
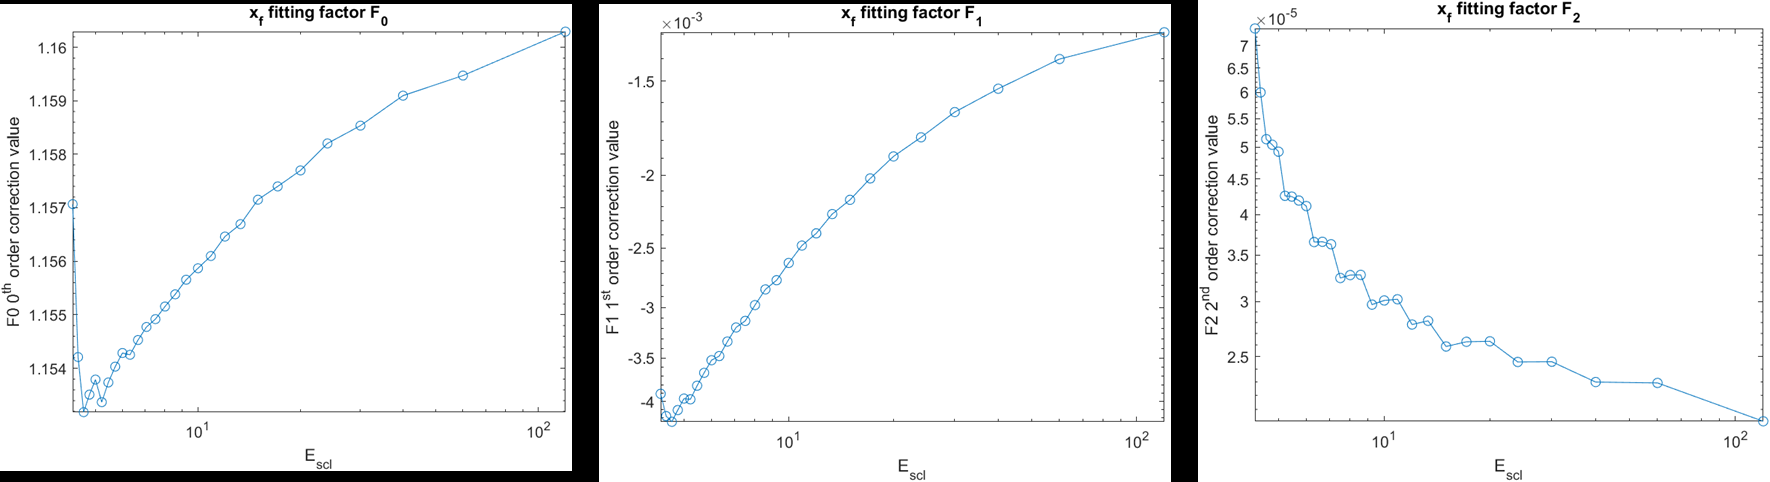 Fig. 5. x–position correction coefficients as a function of Escl
Correcting time of flight
We also fit the time delay between simulated TOF (TOFs) and TOF with no deflector field[ (TOFN) caused by the deflector distortions. These results are pictured in Figure 6, where the time delay was fit according to the following equation:
![]()
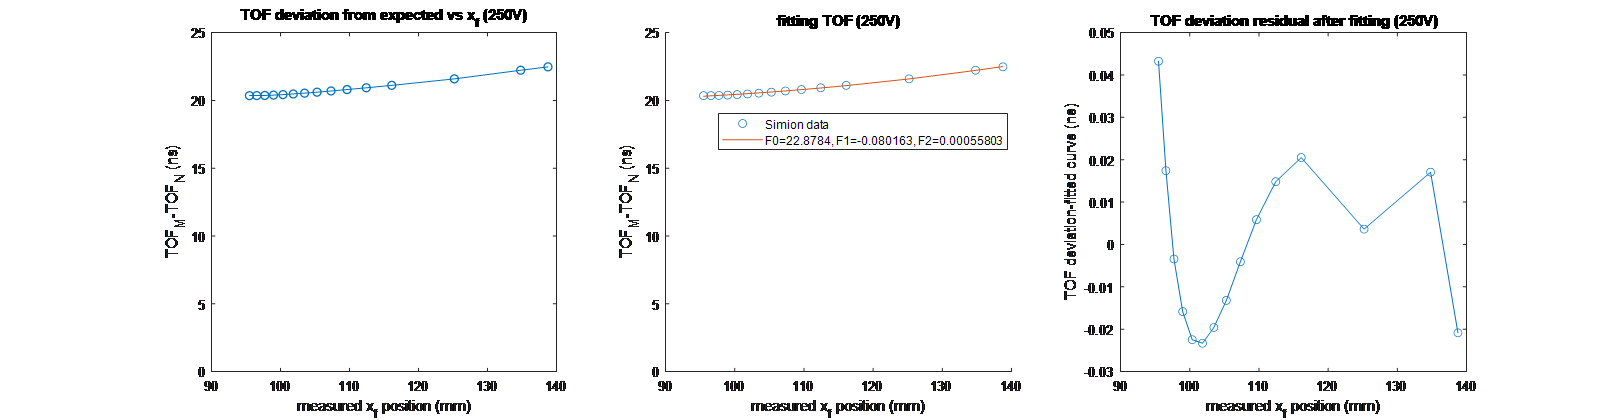 Fig. 6. Time of flight fitting (left), residual of data and fit curve (right) as a functions of xf
In Figure 7, the TOF model coefficients F0, F1, and F2 were graphed as a function of the initial fragment conditions Escl.
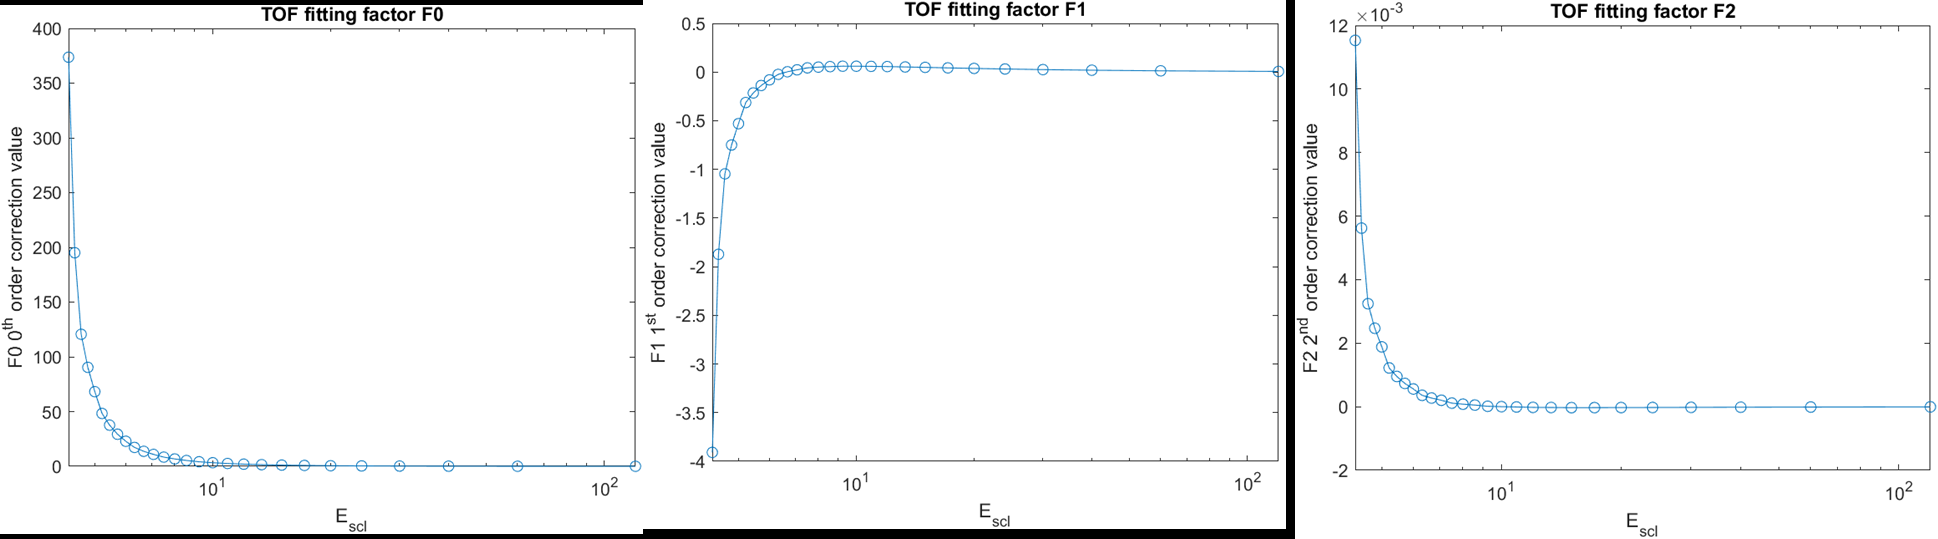
Distortions in the y-direction were neglected for the time being because they were comparatively small.
In the future, we would like to fit the F vs Escl curves so that we can easily correct data from a variety of initial conditions. Comparison of the virtual deflector and simulated data in the x, y, and z directions will be necessary to ensure the accuracy of this model. Eventually, we will use the fitting expressions to recover undistorted data.
Acknowledgments
I would like to thank the Kansas State University REU faculty, especially my advisor, Professor Itzik Ben-Itzhak and his post-doctoral fellow, Dr. Chandan Bagdia for providing me with this opportunity and guiding me through this project. I would like to thank the National Science Foundation for funding my research experience and Kansas State University for hosting an amazing program.
This material is based upon work supported by the National Science Foundation under Grant No. #2244539. Any opinions, findings, and conclusions or recommendations expressed in this material are those of the author(s) and do not necessarily reflect the views of the National Science Foundation.