A Median Statistics Estimate of the Distance to M87
Sofia Splawska, Case Western Reserve University, Physics Major
Mentored by Dr. Bharat Ratra
This project falls under the science of Cosmology, which studies the universe’s structure, content, and evolution on the largest scales of space and time. Distances are crucial to Cosmology because, in order to know the physical characteristics (e.g. brightness, size) of objects in the sky, we must know their distance from us. Furthermore, the better the precision and accuracy with which we measure the distance, the better the precision and accuracy with which we can calculate the physical characteristics. The better we know these characteristics, the better we can model the universe and understand Cosmology.
The distance to the galaxy M87 (Messier 87) of the Virgo cluster in particular is of interest for a few reasons. Distances are only able to be measured directly to a radius of 100 parsecs (pc) from Earth, which is a tiny fraction of the size of our galaxy. This is insufficient for nearly every astronomical study, let alone Cosmology, which is concerned with the universe as a whole. Therefore, outside of this ~100 pc sphere, we must employ indirect methods of measuring distance that rely on various assumptions and properties of celestial objects, which themselves are known to limited precision and accuracy. This system of successive calibrations, which build on each other in distance, is known as the extragalactic distance ladder. As M87 lies essentially at the center of the nearest cluster to us, it is an important “rung” of the distance ladder. A reliable measure of the distance to M87 allows us to refine our understanding of the distance to further populations such as the Coma and Fornax clusters and beyond. Additionally, a better measurement of the distance to M87 allows us to better study the galaxy itself, for example, its stellar population and the supermassive black hole at its center which is most famous for being the first black hole to be imaged (Figure 2).
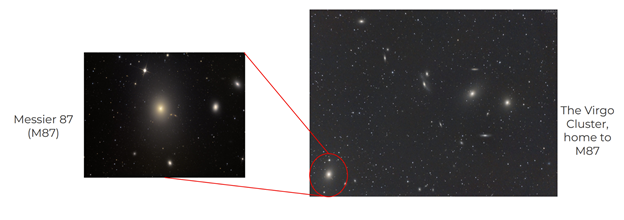
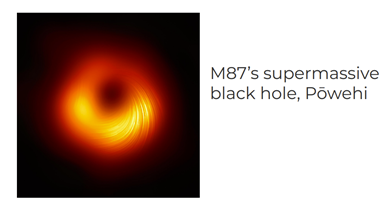 Figure 2: The supermassive black hole at the center of M87 (Event Horizon Telescope Collaboration 2019)
In science, whenever we have a compilation of data, the next step is usually to calculate a central estimate (e.g. mean, median, weighted mean, etc.) to characterize the dataset. In Cosmology, either the (arithmetic) mean or the weighted mean are most commonly used. In order for any type of mean to be a reliable estimate, and in order to employ widely used methods such as chi-squared likelihood analysis, one must assume that the distribution of error-affected measurements is Gaussian.
There is a subtle issue here. In physics, it is a nearly universal assumption that if there were no systematic errors (brought about by the measurement apparatus, calibrations, or incomplete knowledge of the physical processes, etc.) the distribution of data with statistical errors alone would follow a Gaussian distribution. Additionally, it is almost always assumed that the distribution of data including systematic errors is likewise Gaussian! Therefore, mean statistics and other methods which assume Gaussianity are often applied to non Gaussian data sets. Gaussianity is a poor assumption in many cases in astronomy. Some famous examples of such non-Gaussian datasets are measurements of the Hubble constant and of the distance to the Large Magellanic Cloud (LMC), a small satellite galaxy of the Milky Way.
The assumptions of mean statistics analyses are as follows: 1. individual data points are statistically independent, 2. there are no systematic effects, 3. the errors are Gaussianly distributed, and 4. one knows the standard deviation of these errors. When the requirement of Gaussianity is not satisfied, the mean is not a reliable estimate of the quantity in question. On the other hand, median statistics only relies on assumptions 1. and 2. In the case of a non-Gaussian data compilation, the median is the most reliable central estimate. Due to assumption 2. of median statistics, it makes no use of the error bars on individual measurements. Therefore the median generally has larger error bars on it than the mean would for the same dataset. We argue that in the case of a non-Gaussian data compilation, the less constraining estimate of median statistics is nevertheless more accurate and is the most favorable option (Gott et. al. 2001).
In order to determine which central estimate is most appropriate for a given dataset, we must test whether or not it is consistent with Gaussianity. To do this, we must first calculate at least one central estimate. Using a central estimate and its uncertainty, we construct an error distribution. The test of Gaussianity is accomplished by running the error distribution through the Kolmogorov-Smirnov (KS) test. The results of this test will determine the degree of Gaussianity of the data compilation and allow us to decide which central estimate to report.
The true median (TM) is defined as the median of the dataset as the number of measurements, N, approaches infinity. The error bars on the median are calculated by considering the probability under P vs index i. Each element Pi of P represents the probability that the TM falls between the measurements Mi and Mi+1 and the expression corresponds to the binomial distribution (Figure 3). Starting at the median, we integrate in each direction until we have reached half of one sigma of the area under the curve in terms of the index i. To find the one sigma error bars in the units of measurement, we overlay the relevant indices onto our data compilation (Figure 4).
Armed with a central estimate and its 1 sigma error bars, we construct an error distribution. An error distribution is a histogram of how many standard deviations each measurement deviates from the central estimate. For example, in the error distribution shown in Figure 5, there are 4 measurements which are 2 standard deviations above the central estimate.
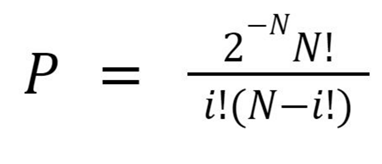 Figure 3: The probability P that the true median falls between measurements Mi and Mi+1
 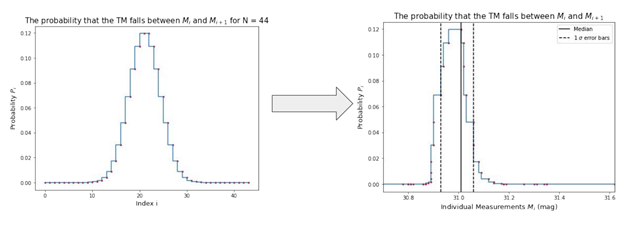 Figure 4: Probability vs index on the left, Probability vs the measurement at index i on the right
 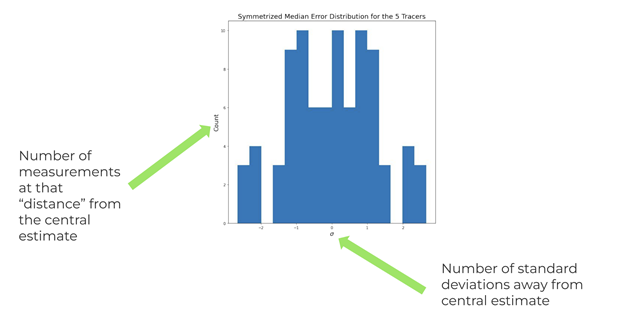 Figure 5: An example error distribution
The KS test is a statistical test that measures the similarity between an empirical cumulative distribution function (ECDF) and a continuous probability distribution. The ECDF is calculated from the error distribution. In this case, the probability distribution against which we will test our ECDF is the Gaussian. The KS test will return something called a p-value, which allows us to determine whether or not our dataset is consistent with Gaussinianity. The rigorous definition of the p-value is the probability that we can reject the null hypothesis that our data did not come from the tested distribution. Conventionally, we reject the null hypothesis for a p-value greater than or equal to 0.95. In this case, a p-value greater than or equal to 0.95 means our distribution is consistent with Gaussianity.
The results of the KS test will tell us whether we should report the mean or the median as the central estimate. If we find our distribution of data to be consistent with Gaussianity, then we are justified in applying mean statistics. However, if we find it to be non-Gaussian, then median statistics will provide the best central estimate.
Since any non-Gaussianity is assumed to result from systematic error, we can learn something about these errors by comparing our distribution to a Gaussian. We do this systematically by dividing our error distribution by a scale factor S, which we increment from 0 to 10. At each step, we calculate the p-value. Since we are dividing by S, S>1 makes our distribution more narrow and S<1 makes our distribution wider. If we find that a certain value of S makes our distribution much nearer to a Gaussian (in terms of p-value) we can conclude something about the size of the reported systematic errors. If we find that an S<1 scaling greatly improves our p-value, we conclude that the systematic errors may have been underestimated since the scaling acts as an increased systematic error. Likewise, if we find that an S>1 scaling greatly improves our p-value, we conclude that the systematic errors may have been overestimated since the scaling acts as decreased systematic error. The specific comparisons between the p-values from median vs weighted mean error distributions are not quantitative and are included for qualitative reinforcement of the degree of Gaussianity.
The datasets we analyzed were compiled by de Grijs & Bono (2020). The authors started by receiving nearly 8000 hits for the galaxy M87 in the NASA/Astrophysics Data System. They performed a statistical analysis of these data and found 213 of the distance measurements to be statistically independent of each other (we call this dataset A), which is necessary for virtually any type of statistical analysis. The authors split these 211 measurements by the method by which the measurement was made, or by “tracer”. The data were split into 15 tracers. The authors chose 5 of these tracers (a total of 43 data points, we call this dataset B) which they found to be “internally consistent” and lead to “tight averages.” Furthermore, they adjusted the 43 distance measurements in dataset B to conform to an LMC distance modulus of 18.49 mag (de Grijs & Bono, 2020). The authors preceded to eliminate the measurements from 2 of the tracers in dataset B due to systematic error. However, chose to analyze only datasets A and B because we believe that it was best to keep a larger sample size. Systematic error does not cause an error for median statistics, and shouldn’t change the median as long as the systematic error does not affect a majority of the dataset.
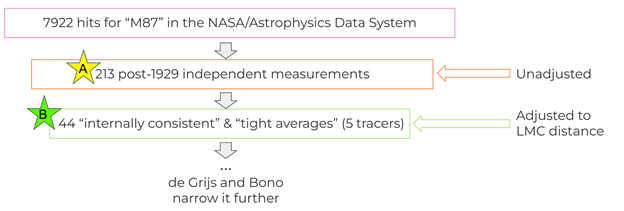 Figure 6: A schematic of our data mining
The error distributions and KS test results for datasets A and B are shown in Figures 7 and 8, respectively. Clearly, both datasets are far from being consistent with Gaussianity. Furthermore, both require S>1 scaling to approach Gaussianity so we conclude that the individual systematic errors may have been overestimated. Based on this intense lack of consistency with Gaussianity, we argue that the median is the best central estimate to report in this case.
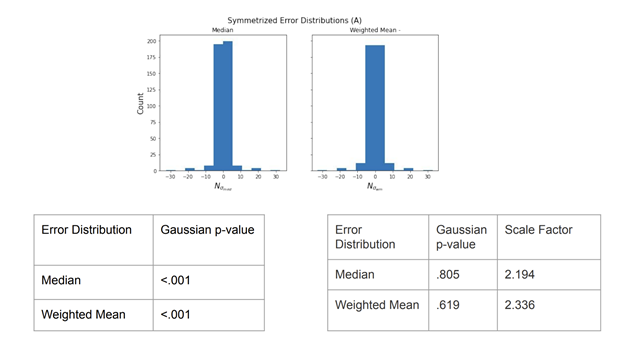 Figure 7: Results from dataset A
 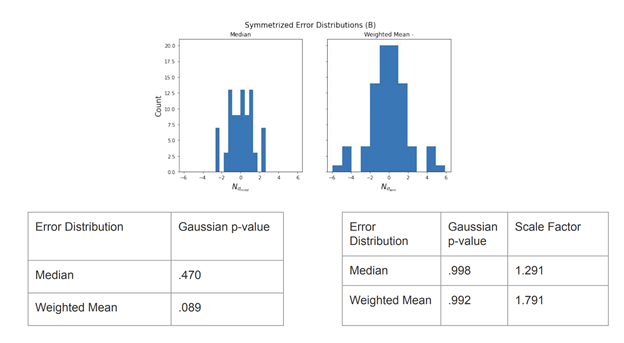 Figure 8: Results from dataset B
The medians and its 1 sigma error bars we calculated, as well as the arithmetic (regular), mean that was calculated by de Grijs and Bono based on their dataset of 28 measurements are shown in Figure 9. The values are initially given as the distance modulus, from which we calculate the distance in parsecs using the formula in Figure 10 and we employ the error propagation formula to obtain the pc error bars. We can see that they are all consistent with each other to within their error bars. Additionally, although in general, we expect the median to have larger error bars on it than the mean, we can see that our error bars are about half the size of de Grijs & Bono’s. We believe this is because we used larger datasets, which decreases the statistical error.
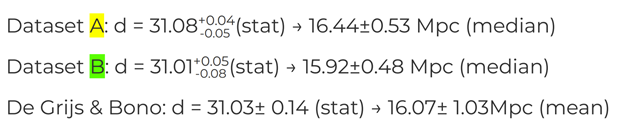 Figure 9: Our results
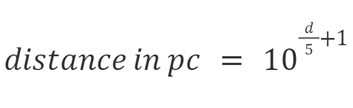 Figure 10: The formula to obtain pc distance from the distance modulus
As a result of the extreme non-Gaussianity of the distance measurements to M87, we believe our median statistics results provide the most reliable estimate of the distance.
Acknowledgments
I would like to acknowledge Dr. Bharat Ratra for mentoring this project, Nicholas Rackers who contributed equally to this project, and Dr. Bret Flanders, Dr. Loren Greenman, and Kim Coy for making this REU program possible. I would also like to thank Kansas State Univeristy and the National Science Foundation, who funded the REU program under grant No. 1757778.
Additional Information Not Included Above
Event Horizon Telescope Collaboration. "First M87 event horizon telescope results. IV. Imaging the central supermassive black hole." (2019).
Gott III, J. Richard, et al. "Median statistics, h0, and the accelerating universe." The Astrophysical Journal 549.1 (2001): 1.
De Grijs, Richard, and Giuseppe Bono. "Clustering of Local Group distances: publication bias or correlated measurements? VI. Extending to Virgo cluster distances." The Astrophysical Journal Supplement Series 246.1 (2019): 3.