


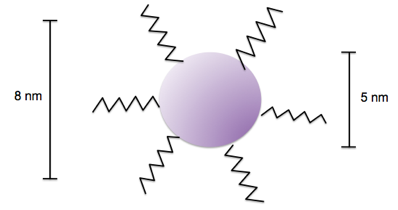
My goal for the summer was to research the behavior of gold nanoparticle solutions in uniform electric fields. As I described on my homepage, nanoparticles are small clusters of gold atoms. The nanoparticles that I first worked with were suspended in toluene. Ligands - molecules that bond to the nanoparticle at its surface, were bonded to these gold nanoparticles. These ligands prevented the gold nanoparticles from aggregating and precipitating out of the solution. Including the ligands, the nanoparticles I worked with were each around 8 nanometers long. The specific ligand used was DDT or dodecanethiol (CH3(CH2)10CH2SH).
When beginning this project, I knew that a K-State physics student last year observed a “jump” in a gold nanoparticle-toluene solution when placed in an electric field. The pure toluene solution failed to jump in a similar way. He discovered that this jump was not directly related to the change in dielectric constant that occurs from adding the nanoparticles to toluene. My first step this summer was to reproduce this “jump.”

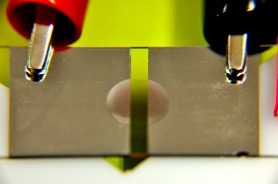
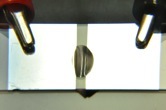
This summer I updated my setup multiple times until l I found the one most ideal for my experiment. I started simple, working with only a microscope slide. I used a vacuum evaporator to coat the slide with two thin aluminum strips. I attached an alligator clip to each metal strip. The alligator clips were hooked up to my power supply. On the picture to the right, the voltage travels to the right aluminum-coated strip. The left strip is attached to ground, which causes the field lines to travel from right to left (the polarity was reversed on my power supply, which is why ground is red for my experiment).

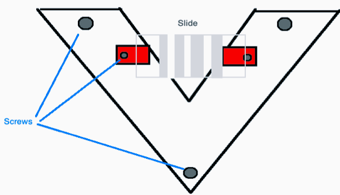
To look for the “jump” that was observed previously, I would place a drop of nanoparticle solution directly on the microscope slide. I was careful to make sure that the drop was on the glass, in between the two metal strips on the slide. This exposed the drop of nanoparticle solution to as uniform of an electric field as possible. I was able to observe the “jump” of the nanoparticle solution at many different voltages. The first problem I encountered was that the drop frequently rolled to the edge of the slide, because the microscope slide wasn’t on a level enough surface. I designed a slide holder to fix this problem, and built it in the student workshop. I constructed it using plastic pieces and small screws. I used this slide holder for the rest of my summer research, with the exception of my third week, during which I tried to measure the “jump” with an optical microscope. I quickly realized that I needed to conduct my experiments on a larger scale, and went back to the slide holder.


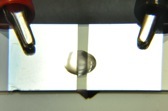
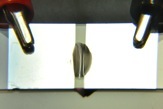
Dr. Sorensen taught me that before we try for quantitative results, we first need qualitative results. So I began using a Nikon SLR camera. The images below show the nanoparticle solution reacting to an applied electric field. The drop moves away from the electrodes and fills up the space in between the two aluminum strips. Dr. Sorensen and I decided that this suggested that the nanoparticle solution might be conducting electricity. We decided that for the rest of the summer I would place a thin coverslip on the microscope slide. This will prevent the nanoparticle solution from coming into contact with the aluminum strips.
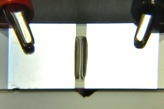

Using the same Nikon camera, I began taking videos of the experiment. Below is one of the videos I took of an 8 microliter drop of nanoparticle solution. The video shows the time before turning on the voltage (initially 0 V) and then applying a voltage of 2500 V. The glass spacing is 3 mm wide, and the cover slip is .1 mm thick.
In the video, right as I turn on the voltage the nanoparticle solution quickly “surges” towards its center before flattening out - this is the “jump” that I have been looking for. Very shortly afterwards the drop is attracted to the right aluminum strip (in the opposite direction of the electric field lines), even after I turn the voltage off. After discussing these videos and showing them to the members of the N.I.R.T. group, Dr. Sorensen and I decided to focus on the first instant when the drop “flattens” out - which we had previously described as the “jump.” We decided this would be the simplest course with the greatest potential to be reproducible.


To quantitatively describe the “flattening” of a drop of nanoparticle solution, I measured its contact angles at rest, and then applied different voltages and measured how the contact angles of the drop changed.

A contact angle is the angle a drop of liquid makes with the surface it rests on. A contact angle measurement is an average of the left and right contact angles. Sean McBride, a graduate student at Kansas State University, taught me how to prepare and coat coverslips that would produce large, measurable contact angles. We used a silane coating produce that Sean developed through his studies, which is described in Appendix C of:
“Improved in situ spring constant calibration for colloidal probe atomic force microscopy”
by Sean McBride and Bruce Law.
We first attempted the coating procedure on thin .1 mm coverslips. We successfully coated only two and a half, because we kept accidentally breaking them. The next week we tried the same procedure on .5 mm coverslips. Our second attempt appeared much better, but the .5 mm coverslips would not produce good contact angles with our gold nanoparticle solutions. I went back to the last of our coated .1 mm coverslips from the previous week, and was able to measure a good contact angle, on average initially 25 degrees for a drop of the gold nanoparticle solution. I took all my data using this one slide.
To collect data, I programmed a side angle camera to take a series of images spaced less than half a second apart. As I turned on and off the voltage, I could measure the change in contact angle of a drop of nanoparticle solution. I took these measurements using the same .1 mm coverslip, a microscope with two aluminum strips 3 mm apart, and 8 different 1 microliter drops of a gold nanoparticle tert-butyl toluene solution. The following link is the excel spreadsheet of all the data that I took this summer:
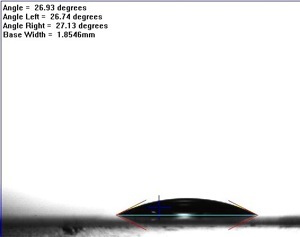
The contact angle of a 1 microliter drop nanoparticle solution, when the voltage is off. The drop is on a silane coated .1 mm coverslip.
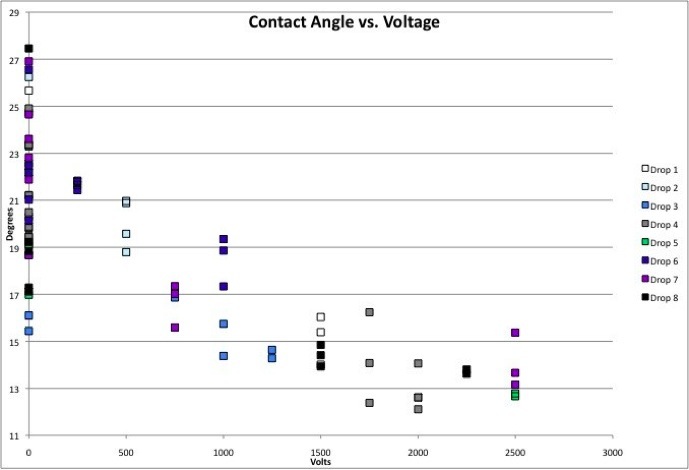


The graph below shows contact angles as a function of voltage for the 8 different drops that I used to collect data.