
Characterizing the EBIS-C Spectrometer in Nonfocusing and Focusing Modes
Goal: Understand the performance of the EBIS-C spectrometer when used in different ways and determine the best operating conditions for both nonfocusing and focusing spectrometer modes.
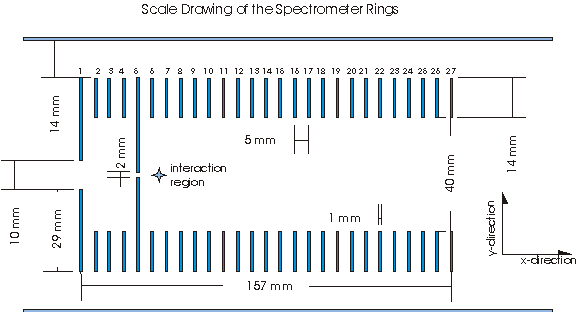
The spectrometer characterized in this document consists of 27 equally spaced (5 mm apart) ring electrodes arranged according to the scale drawing shown below.
Length of spectrometer: 157 mm
Length from end of spectrometer to detector: 696 mm
Length from interaction region to detector: 820 mm
Interaction region: Midpoint between plates 6 and 7, which we choose to be xo = 57.5 mm and yo = 0 mm.
The rings themselves are 1mm thick stainless steel. Plates 1-5 are connected by 100MΩ resistors. Plates 5-27 are connected by 10MΩ resistors. A grounded mesh is located 6 mm in front of the detector. For this spectrometer characterization, the mesh will always have a voltage of zero, and the detector will always have a voltage of -2000 Volts.
In this paper, the X direction is defined as parallel to the spectrometer axis (i.e. approximately the same direction that a beam travels through the spectrometer). The Y direction is perpendicular to the spectrometer axis. As the spectrometer has radial symmetry, this Y direction includes any possible angle in the plane perpendicular to the spectrometer. Therefore, it will not be necessary to use a Z direction.
Our analysis will consist largely of analyzing the time of flight (TOF) of particles under various conditions simulated by the SIMION program. The TOF formula has the general form TOF = a(M/q)1/2 + To, where a and To are constants, M stands for the particle mass, and q is the particle charge. This produces a linear relationship, which means that the TOFs of different particles under similar conditions are related by a factor of the square root of the mass to charge ratio.
For a full analysis of the spectrometer, we will need to examine the characteristics of two different kinds of particles, recoil ions and beam fragments. A typical spectrometer experiment involves a jet of neutral atoms such as Helium or Argon that runs perpendicular to the spectrometer axis through the interaction region. A molecular ion beam running along the spectrometer axis also passes through the interaction region, and some of the molecules will collide with the atoms. In each collision the molecule will break, resulting in at least two beam fragments. Any beam fragments that retain or gain a positive charge will be accelerated through the spectrometer toward the detector. The atom in each collision becomes ionized, is knocked off course, and is also accelerated through the spectrometer to hit the detector. The ionized atoms are recoil ions.
The spectrometer can be used in two different modes, nonfocusing and focusing. In nonfocusing mode, a voltage is applied to the 5th plate of the spectrometer, and the voltage decreases linearly from that plate all the way down to the grounded 27th plate. The focusing spectrometer will be explained in more detail later on. Suffice it to say that to fully understand the spectrometer, we need to examine four different areas: recoil ions in the nonfocusing spectrometer, recoil ions in the focusing spectrometer, beam fragments in the nonfocusing spectrometer, and beam fragments in the focusing spectrometer.
Recoil Characteristics of Nonfocusing Spectrometer
The time of flight (TOF) of a recoil ion argon (39.984 amu) when the spectrometer is used in nonfocusing mode with the spectrometer voltage (the voltage on the 5th plate) set at 1000 V, shows the following tendencies:
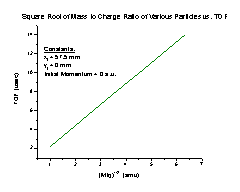
1. The Ar+ TOF increases linearly as the initial position of a particle along the X axis approaches the detector (Figure A). It follows the equation TOF = 12.29898 + 0.0296Xi, where Xi is the initial position of the particle.
2. As the initial Y position of a particle gets farther from the spectrometer axis, the TOF increases in a manner we are not sure how to explain (Figure B). It is most likely due to numerical limitations of SIMION. At any rate, the effect is approximately 50 picoseconds in duration. Our detector’s best practical time resolution is on the order of 50 picoseconds, so the effect is beyond our detector’s ability to measure. Therefore, this should not affect the performance of the spectrometer.
 Figure
A Figure B
Figure
A Figure B
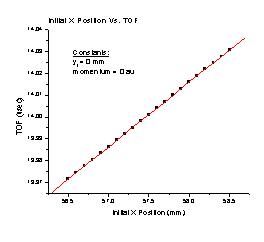
3. As the Ar+ particle’s initial momentum parallel to the spectrometer axis increases (Figure C), the TOF decreases with a perfect correlation to the formula
TOF = 14.00107 – 0.0016 p – (7.14132 x 10⁻⁷) p2, where p is the momentum in a.u.
4. Increasing the initial momentum in the Y direction with no momentum in the X direction results in an increased TOF (Figure D). It follows the equation TOF = 14.00105 + (3.23803 x 10⁻⁶) p + (9.17684 x 10⁻⁷) p2, where p is the initial momentum of the particle in a.u. Note that this is a small effect. This entire graph covers only 5 nanoseconds, and most of the structure occurs with differences of a few hundred picoseconds. It is quite possible at this point that we are taxing SIMION to its limit. The slight, fine structure seen on this graph is a result of SIMION’s limitations
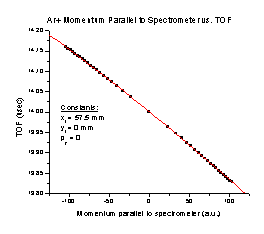
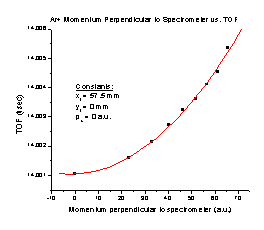
Figure C Figure D
To test whether the TOF would behave in a similar fashion with a particle of different mass than Ar+, we tried some of the same runs again using H+ (1.008 a.m.u.).
To determine whether the TOF would behave in a similar fashion, we compared the TOF equations we found for the two particles. Since the general form of the equations is a constant times (M/q)1/2, plus To that is determined only by our equipment, the equations should be similar by a factor of square root M/q, where M is the mass of the particle and q is the charge. So to compare H+ and Ar+ TOFs, we divide the Ar+ TOF by the H+ TOF. Since both particles have a charge of one, if the equations are similar we should get the square root of the particles’ mass ratio (6.29531).
1. The TOF increases linearly as the initial position of H+ along the X axis approaches the detector (Figure E). It follows the equation TOF = 1.95364 + 0.0047Xi, where Xi is the initial position of the particle.
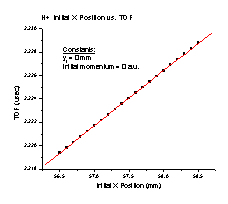
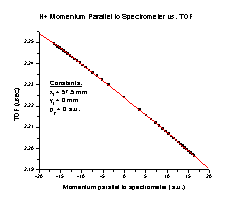
Figure E Figure F
|
Xi Value (mm) |
H+ TOF (µsec) |
Ar+ TOF (µsec) |
TOF Ar+/ TOF H+ |
|
0 |
1.95364 |
12.29898 |
6.29542 |
|
1 |
1.95834 |
12.32858 |
6.29542 |
|
2 |
1.96304 |
12.35818 |
6.29543 |
|
3 |
1.96774 |
12.38778 |
6.29544 |
The best practical time resolution of our detector is on the order of 50 picoseconds. This means that the TOF Ar+/TOF H+ column is sufficiently equal, because we will only be able to measure accurately to the 4th decimal place. The range of values displayed is sufficient to affirm that the equations are similar, because the initial X position should not be greater than 2 mm. Therefore, we conclude that the initial X position affects the TOF in the same way without dependence on the mass of the particle, although the
TOF Ar+/TOF H+ value we found differs from the mass ratio by 0.001% and we are not sure why. However, this difference is extremely negligible.
2. As the initial momentum of the H+ particle parallel to the spectrometer axis increases (Figure F), the TOF decreases with a perfect correlation to the formula TOF = 2.22405 – 0.0016 p – (4.47326 x 10⁻⁶) p2, where p is the momentum in a.u. Note: negative momentum means that the velocity vector points away from the detector.
|
Pix Value (a.u.) |
H+ TOF (µsec) |
Ar+ TOF (µsec) |
TOF Ar+/TOF H+ |
|
0 |
2.22405 |
14.00107 |
6.29530 |
|
10 |
2.20805 |
13.98500 |
6.33364 |
|
50 |
2.13287 |
13.91928 |
6.52608 |
This shows that the initial momentum of a particle in the X direction affects the TOF differently for particles of different masses.
3. Increasing the initial momentum of H+ in the Y direction with the momentum in the X direction at zero results in an increased TOF (Figure G). It follows the equation TOF = 2.22405 + (3.44398 x 10⁻⁶) p + (5.75993 x 10⁻⁶) p2, where p is the initial momentum of the particle in a.u.
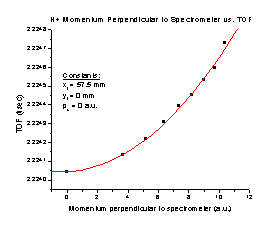
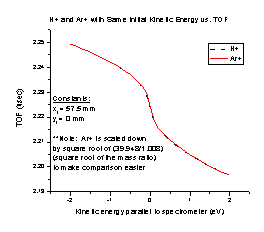
Figure G Figure H
|
Piy Value (a.u.) |
H+ TOF (µsec) |
Ar+ TOF (µsec) |
TOF Ar+/TOF H+ |
|
0 |
2.22405 |
14.00105 |
6.29529 |
|
10 |
2.22466 |
14.00117 |
6.29362 |
|
20 |
2.22642 |
14.00148 |
6.28879 |
The initial momentum of a particle in the Y direction affects the TOF differently for particles of different masses.
We also tested the spectrometer with two particles of different mass and the same kinetic energy (Figure H). We expect the particles in an electrostatic device such as our spectrometer to follow the ratio E/q, where E is the energy of the particle and q is its charge. Therefore, the two graphs should be different only by a factor of the square root of M/q. To check this we divided the Ar+ TOF values by the square root of the mass ratio (Ar+/H+), using the particle masses we entered in SIMION (39.948 amu and 1.008 amu, respectively). The charge is already included in that calculation, since both particles have a charge of one. With proper scaling by the square root of the mass ratio, particles with the same kinetic energy have the exact same TOF. This means that particles in the spectrometer do follow the ratio E/q.
We also tried the spectrometer with two particles that have the same momentum but different masses (Figure I), again scaling the Ar+ graph by the square root of the mass ratio. It makes sense that when the initial momentum is zero the scaled TOF is the same, based on our earlier analysis of the H+ initial X position graph. As the momentum increases, the velocity for the H+ particle increases much faster than the velocity of the Ar+ particle, so the H+ TOF should decrease much more quickly than that of Ar+, as the graph shows. However, this means that we will have to find equations for each individual particle when we are calculating momentum.
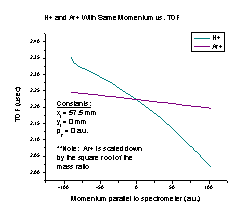
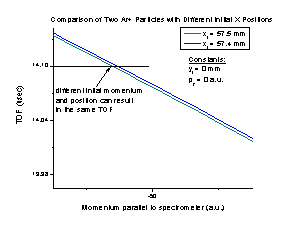
Figure I Figure J
Using the spectrometer in nonfocusing mode will cause problems when calculating a particle’s initial momentum in certain experiments. We calculate the initial momentum of a particle from the TOF and using momentum conservation. However, it is possible for particles with different initial positions and momenta to have the same TOF, as shown in Figure J of a particle starting at 57.5 mm (in green) and at 57.4 mm (in blue).
It is possible for a particle with any given initial momentum and position to share a common time of flight with another particle that has the correct different initial momentum and position. Therefore, in order to calculate the initial momentum properly, sometimes it will be necessary to use the spectrometer with space and time focusing.
Recoil Characteristics of Focusing Spectrometer
Operating the spectrometer in focusing mode requires very few modifications. Instead of allowing the voltage to decrease linearly from plates 5-27 as it does in nonfocusing mode, a focusing voltage (Vf) is placed on the 11th plate of the spectrometer. Then the voltage decrease is as shown in Figure K (exact voltage values will vary based on the Vf voltage used):
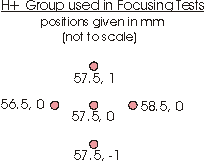

Figure K Figure L
In the interest of keeping the following analysis applicable to any Vs the spectrometer is run at, we will think of the Vf as a particular percent of the Vs. However, in order to keep our experiments uniform for comparison, we will use Vs = 1000 V.
To find the Vf that works best for the EBIS-C spectrometer using SIMION, we set the Vs at 1000 V, varied the Vf, and flew a group of H+ particles (Figure L) starting from rest at the center of the interaction region through the spectrometer. The group consisted of five particles with initial (x,y) positions of (56.5, 0), (57.5, 0), (58.5, 0), (57.5, -1), and (57.5, 1) mm respectively.
Time Focusing
Applying a Vf to the spectrometer allows particles with different initial momenta to “catch up” to each other. A perfectly time focused spectrometer would cause any two particles that started at the same time to hit the detector at the exact same time, no matter what their respective initial momenta were.
To find the best time focusing for the spectrometer (Figure M), we varied the Vf while flying the H+ group using the conditions described above. For each Vf trial, SIMION reports the ending TOF of each individual particle. From that, we found the highest and lowest TOFs of the group. We subtracted the lowest from the highest and divided the result by two, which gave us the error in the time focusing when using that particular Vf.
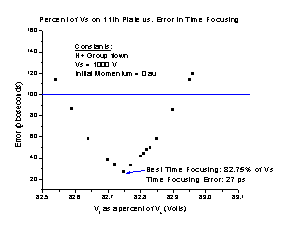

Figure M Figure N
The best operating time focusing voltage is 82.75% of the Vs. However, as we need to determine the best Vf to achieve space focusing as well, it should be noted that any Vf between the range of 82.59% and 82.95% will easily keep the error less than 100 picoseconds.
Space Focusing
A perfectly space focused spectrometer would cause all particles to hit the detector at the same spot, regardless of their initial position. To find the best space focusing for the spectrometer (Figure N), we varied the Vf while flying the H+ group using the conditions described above. For each Vf trial, SIMION reports the ending Y positions of each individual particle. From that, we found the highest and lowest final Y positions of the group. We subtracted the lowest from the highest and divided the result by two, which gave us the error in the space focusing when using that particular Vf.
The best operating space focusing voltage is 82.82% of the Vs, with an error of 0.0009 mm. However, the resolution of our detector is only 0.25 mm, so any Vf that results in an error less than that will give us perfect space focusing, as far as our experimental capabilities are concerned.
Best Overall Operating Voltage
If the spectrometer is operated at the optimum space focusing voltage, the time focusing error will be 47.5 ps, which is still below the best practical resolution of the detector. If the spectrometer is operated at the optimum time focusing voltage, the error in space focusing will be 0.022 mm, also well below the resolution of our spectrometer. Since equipment that will allow the Vf percentage to be accurate to two decimal places is very expensive, it should be noted that operating the spectrometer at 82.8% will give the best overall operating conditions for the spectrometer. It contains the best time focusing voltage within the range of rounding to one decimal place, and even if the actual Vf goes as far off as 82.85%, the largest time focusing error would be 58 ps. The largest space focusing error would be .022 mm, still way below the resolution of our detector.
|
Vf |
Largest Time Focusing Error (ps) |
Largest Space Focusing Error (mm) |
|
82.6% |
113 |
0.09 |
|
82.7% |
58 |
0.06 |
|
82.8% |
58 |
0.02 |
|
82.9% |
113.5 |
0.06 |
We tested the accuracy of the Vf for particles of different mass to see if the resolution would still act as expected. The space focusing is not affected by particles of different mass, because after testing groups of H+, C+, and Ar+ particles in the spectrometer with Vf = 82.8%, we found that all three groups had the same space focusing error.
|
Particle Group |
Space Focusing Error (mm) |
|
H+ |
0.0057 |
|
C+ |
0.0057 |
|
Ar+ |
0.0057 |
The time focusing error is also the same for particles of different masses, but to test it we needed to look at the relative time error for different particle groups flown with Vf = 82.8%. To find the relative time focusing error, we divided the time focusing error of the particle group by the lowest TOF in the group.
|
Particle Group |
Relative Time Focusing Error (Error/TOF) |
|
H+ |
18 x 10-6 |
|
C+ |
18 x 10-6 |
|
Ar+ |
18 x 10-6 |
The error in the focusing is about the same for any Vs. With the Vs at different levels and the Vf always at 82.8%, we flew the H+ group and found very similar relative time focusing errors. The difference between them is so small that we can just ignore it and say the time focusing is equally good when the spectrometer is set at any Vs. It is not necessary to run the space focusing tests as well, since the space focusing error is so far below the resolution of our detector.
|
Spectrometer Voltage |
Relative Time Focusing Error |
|
500 V |
20 x 10-6 |
|
1000 V |
18 x 10-6 |
|
2000 V |
17 x 10-6 |
|
5000 V |
15 x 10-6 |
As several intended experiments with this spectrometer place emphasis on the time focusing of Ar+, its actual time focusing error is given below. It should be noted that for Ar+ from a time focusing standpoint, 82.7% is a better Vf. So, as ions get heavier, if the main goal of the experiment is time focusing, the spectrometer should be operated at 82.7%.
|
Vf |
Time Focusing Error (ps) |
Space Focusing Error (mm) |
|
82.6% |
505.5 |
0.07086 |
|
82.7% |
242.5 |
0.03812 |
|
82.8% |
261 |
0.00565 |
|
82.9% |
538.5 |
0.02714 |
Conclusion
For a basic focusing spectrometer operating summary, remember
1. To best focus the spectrometer, the Vf should be at 82.8% of the Vs.
2. The spectrometer focuses equally well at any Vs.
3. The spectrometer focuses all size particles equally well.
This spectrometer has excellent time and space focusing capabilities and should work well for a range of different experiments.
Beam Fragments in the Nonfocusing Spectrometer
The beam of gas from which the recoil ions analyzed in the first section are produced runs perpendicular to the spectrometer axis through the interaction region. For experiments with the spectrometer, we will send a second beam of particles through the spectrometer along the spectrometer axis. We expect some of these particles to break from colliding with the gas. A Faraday Cup in the center of the spectrometer near the detector collects the particles that do not break. The particles that do break are referred to as beam fragments, and those beam fragments with a positive charge will be accelerated towards the detector by the spectrometer. Almost all the beam fragments in our spectrometer will have an initial kinetic energy not in line with the spectrometer axis and will start at a point off of the axis. This results in two different forms of distortion, which we refer to as the magnification of the initial Y position (MYo) and the magnification of the initial Y velocity (MVy.). The goal of this section is to explore the effects of this magnification and develop equations that will allow us to correct for it. Note that for experiments that require measuring the recoil ions as well as beam fragments the spectrometer must be used in focusing mode, because it has already been demonstrated that the nonfocusing mode will not work for recoil ions.
Magnification of the Initial Y Position
It is expected that a beam fragment with initial energy only in the X direction (note: in our experiments, this X direction energy comes from the energy of the particle beam) which starts at a particular distance yo from the spectrometer axis should hit the detector at the same distance from the spectrometer axis. However, running a simulation in SIMION with H+ “beam fragments” shows that the final Y position (yf) is actually distorted by the electric field in the spectrometer. This distortion is referred to as the MYo, which is defined by yf /yo.
To see if the MYo changed depending on the energy of the particle beam (Ei), we flew H+ beam fragments through the spectrometer with the Vs set at 1000 V and the Ei set for a particular value. For each Ei, we plotted the final Y position vs. the initial Y position (Figure O). The slope of each line (yf /yo) gives the MYo for that line's initial energy.
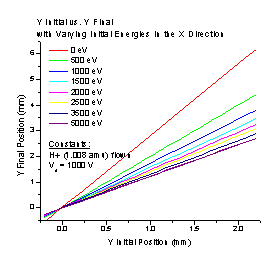
Figure O
To examine the relationship between the MYo and the initial energy, we use a scaled kinetic energy obtained from the equation Escl = Ei /Vs. This will allow us to compare the magnification for a spectrometer no matter what Vs is placed on it. To determine whether or not the MYo is always the same for a particular Escl, we selected the Escl = 2, and found the magnification for (Ei, Vs) pairs of (2000 eV, 1000 V), (3000 eV, 1500 V), and (4000 eV, 2000 V). The MYo is the same through three decimal places, so practically speaking the MYo is the same for a particular Escl, no matter what combination of Ei and Vs create that Escl. This suggests that MYo is a function of Escl. By graphing MYo vs. Escl (Figure P), we determined they are related by a second order exponential decay function:
MYo = 1.17901 + 0.71252e -Escl/ 0.29618 + 0.91658e -Escl/ 1.7692
|
Vs |
MYo for Escl = 2 |
|
1000 V |
1.4730 |
|
1500 V |
1.4731 |
|
2000 V |
1.4733 |
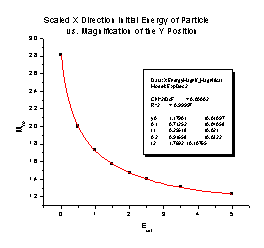
Figure P
We compared the MYo found theoretically using SIMION to the MYo given by the function, and found that the error between the two (defined as the absolute value of the SIMION magnification minus the function magnification) is very small. The relative error (the ratio of the actual error to the SIMION magnification) is less than one percent, so the function works very well, and quite well enough to find the MYo correction for any experiment with the spectrometer.
|
Escl |
SIMION MYo |
Fit MYo |
Error |
Relative Error |
|
1.5 |
1.573 |
1.576 |
0.003 |
0.002 |
|
2 |
1.473 |
1.476 |
0.003 |
0.002 |
|
2.5 |
1.403 |
1.402 |
0.0004 |
0.0003 |
|
3.5 |
1.310 |
1.306 |
0.005 |
0.003 |
Magnification of the Initial Y Velocity
A beam fragment’s initial velocity in the Y direction (VYi) causes magnification if the yf reported from a simulation run in SIMION is different from the expected value calculated using TOF * VYi = yexpected. To see if this happens for the EBIS-C spectrometer, we flew H+ beam fragments with three different initial Y velocities. We set the Vs and Ei at 1000 V and 1500 eV, respectively, thus producing an Escl of 1.5. As the yf we obtained was different from the expected value, we defined the MVy as the ratio of yf to yexpected. Note also that the MVy is the same for any VYi.
|
Vs = 1000 V Ei = 1500 eV Escl = 1.5
|
|||
|
VYi (mm/µsec) |
Y Expected (mm) |
Y Final (mm) |
MVy |
|
0.5 |
0.610608 |
0.666407 |
1.091 |
|
1.0 |
1.221216 |
1.332834 |
1.091 |
|
1.5 |
1.831809 |
1.999251 |
1.091 |
We varied the Vs and Ei while keeping the same Escl and found that the MVy remains constant for a particular Escl. So, the magnification of the initial Y velocity can be written as a function of Escl.
|
Vs = 2000 V Ei = 3000 eV Escl = 1.5 |
|||
|
VYi (mm/µsec) |
Y Expected (mm) |
Y Final (mm) |
MVy |
|
0.5 |
0.431968 |
0.471416 |
1.0913 |
|
1.0 |
0.863937 |
0.942834 |
1.0913 |
|
1.5 |
1.2959055 |
1.414254 |
1.0913 |
By graphing MVy vs. Escl for various values of Escl (Figure Q), we determined the function to be a second order exponential decay
MVy = 1.02777 + 0.14667e -Escl/ 0.35555 + 0.14628e -Escl/ 1.72715
Which for all practical purpose has an error (defined by the absolute value of the theoretical magnification from SIMION minus the magnification calculated with the function) of zero. Therefore, the function will work very well to find the MVy correction for experiments with the spectrometer
|
Escl |
SIMION MVy |
Fit MVy |
Error |
|
0.25 |
1.227 |
1.227 |
0 |
|
0.5 |
1.173 |
1.173 |
0 |
|
1.5 |
1.091 |
1.091 |
0 |
|
3 |
1.054 |
1.054 |
0 |

Figure Q
It is important to note that both MYo and MVy increase rapidly for Escl < 1.5.
Combination of Magnification Effects
For any real system, most of the beam fragments in the spectrometer will have both a non-zero initial Y position and an initial Y velocity. This means that both magnification effects will influence the fragment’s final position. A model that works well for similar spectrometers states that the total magnification ym is given by ym = yfo + yv, where yfo = MYo * yo, the final Y position caused by the magnification of the initial Y position, and yv = MVy * VYi * TOF, the final Y position caused by the magnification of the initial Y velocity. In other words, by adding the magnified Y positions of both effects, we should get the actual ym. If the model works, this ym will be equal to the final Y position reported by SIMION.
To determine whether the model works for the EBIS-C spectrometer, we tested it with five H+ particles at random points and initial velocities. For each set of yo and VYi, we calculated the ym using the model and compared it to the final Y position given by SIMION. For ease in calculation, we chose an Escl = 1, with the Vs and Ei at 1000 V and 1000 eV, respectively.
|
yo (mm) |
VYi (mm/use) |
MYo |
yfo (mm) |
MVy |
yv (mm) |
|
1 |
1 |
1.724 |
1.724 |
1.119 |
1.542 |
|
2 |
1.3 |
1.724 |
3.448 |
1.119 |
2.005 |
|
0.4 |
1.6 |
1.724 |
0.690 |
1.119 |
2.467 |
|
-0.6 |
0.5 |
1.724 |
-1.035 |
1.119 |
0.771 |
|
-2 |
0.2 |
1.724 |
-3.448 |
1.119 |
0.308 |
|
ym Calculated with Model (mm) |
Final Y Position reported by SIMION (mm) |
Error |
Relative Error |
|
3.266 |
3.271 |
0.005 |
0.002 |
|
5.45 |
5.46 |
0.01 |
0.002 |
|
3.157 |
3.160 |
0.003 |
0.001 |
|
-0.264 |
-0.265 |
-0.002 |
0.01 |
|
-3.14 |
-3.15 |
-0.01 |
0.003 |
The relative error is only a few tenths of a percent for most situations in the spectrometer. The relative error is larger for the yo = -0.6 only because it has such a small final position that even small absolute errors have a much larger impact on the relative error. However, even 1% error is fantastic for an experimental correction. Therefore, this model will allow us to accurately correct for magnification in experiments with the nonfocusing spectrometer.
Beam Fragments in the Focusing Spectrometer
The EBIS-C spectrometer was designed so that the recoil ions and the beam fragments could all be measured at once. Doing this will require using the spectrometer in focusing mode, which will cause its own variations on the MYo and MVy. This section will explore the effects of the focusing voltage on the magnification. Since we determined the best Vf to be 82.8% of the Vs in the previous study of recoil ions, we will use that Vf throughout the following analysis.
Magnification of the Initial Y Position
First, we made sure that the relationship between Vs and Ei holds true for the focusing spectrometer. We varied the voltage while keeping a constant Escl and compared the MYo for each voltage. As long as the Escl is constant, the MYo remains the same, although each Escl has an MYo different from its MYo for the nonfocusing spectrometer.
|
Vs |
MYo for Escl = 2 |
|
1000 |
1.2169 |
|
1500 |
1.2171 |
|
2000 |
1.2171 |
To find the magnification of the initial Y position as a function of Escl, we flew H+ beam fragments through the spectrometer with the Vs at 1000 V and the Ei set for a variety of values. By plotting yf vs. yo for a particular Escl and taking the slope, we found the MYo for that Escl. Then we graphed Escl vs. MYo (Figure R) and found an inverted Morse Potential function to fit the graph. This gives us the equation:
MYo = -0.13007*[e-2 * 2.34361*(Escl – 0.39028) – 2e-0.29663 * (Escl – 0.39028)] + 1.05528
which fits the MYo value we found using SIMION with an error of less than 0.1%.
Since this equation will be difficult to enter into programming code, we tried to fit the data with a 2nd degree polynomial, but the fit is much worse (R-square = 0.39), and the higher degree polynomials will be just as complicated as the best equation. The equation given is clearly the best fit.
|
Escl |
SIMION MYo |
Fit MYo |
Error |
Relative Error |
|
0.25 |
1.074 |
1.075 |
0.001 |
0.001 |
|
0.5 |
1.2286 |
1.2293 |
0.0008 |
0.0006 |
|
1 |
1.2654 |
1.2649 |
0.0005 |
0.0004 |
|
2 |
1.2170 |
1.2166 |
0.0004 |
0.0003 |

Figure R
Magnification of the Initial Y Velocity
To find the effects of the magnification of the initial Y velocity we first tested the spectrometer to see if the MVy remained constant for a particular Escl. We found that the MVy is constant for a particular Escl even when the spectrometer is used in focusing mode, but it has a different value than the MVy for the same Escl in nonfocusing mode.
|
Vs = 1000, Ei = 1500, Escl = 1.5 |
|||
|
VYi (mm/use) |
Y expected (mm) |
Y Final (mm) |
MVy |
|
0.5 |
0.6089795 |
0.662562 |
1.08799 |
|
1 |
1.217959 |
1.32513 |
1.08799 |
|
1.5 |
1.8269385 |
1.987689 |
1.08799 |
|
Vs = 1500, Ei =2250, Escl = 1.5 |
|||
|
VYi (mm/use) |
Y expected (mm) |
Y Final (mm) |
MVy |
|
0.5 |
0.49737751 |
0.541121 |
1.08795 |
|
1 |
0.994755 |
1.082245 |
1.08795 |
|
1.5 |
1.4921325 |
1.623359 |
1.08795 |
By applying a second order exponential decay equation to a graph of MVy vs. Escl (Figure S), we found the equation for the magnification of the initial Y velocity in a focusing spectrometer:
MVy = 0.99362 + 0.0908e-Escl/ 6.23221 + 0.14413e-Escl/ 0.81316
|
Escl |
SIMION MVy |
Fit MVy |
Error |
Relative Error |
|
0.5 |
1.1552 |
1.1554 |
0.0002 |
0.0002 |
|
1.0 |
1.1126 |
1.1131 |
0.0005 |
0.0004 |
|
1.5 |
1.088 |
1.0877 |
0.0003 |
0.0002 |
|
3 |
1.0531 |
1.0533 |
0.0002 |
0.0002 |
which gives a magnification value that has at the most a 0.04% error from the MVy found using SIMION. Again, we tried to find a simpler 2nd degree polynomial equation, but the fit was still much worse (R-square = 0.91). The equation given is clearly the best fit.

Figure S
Combination of Magnification Effects
To see if the model for the nonfocusing spectrometer, ym = yfo + yv, works for the focusing spectrometer as well, we tested five random points and initial velocities. For each set of yo and VYi, we calculated the ym using the model and compared it to the final Y position reported by SIMION. For ease in calculation, we used Escl = 1, with Vs and Ei equal to 1000 V and 1000 eV, respectively.
|
yo (mm) |
VYi (mm/use) |
MYo |
yfo (mm) |
MVy |
yv (mm) |
|
1 |
1 |
1.265 |
1.265 |
1.113 |
1.530 |
|
2 |
1.3 |
1.265 |
2.530 |
1.113 |
1.989 |
|
0.4 |
1.6 |
1.265 |
0.506 |
1.113 |
2.448 |
|
-0.6 |
0.5 |
1.265 |
-0.759 |
1.113 |
0.765 |
|
-2 |
0.2 |
1.265 |
-2.530 |
1.113 |
0.306 |
|
ym Calculated with Model (mm) |
Final Y Position reported by SIMION (mm) |
Error |
Relative Error |
|
2.795 |
2.79439 |
0.0003 |
0.0001 |
|
4.52 |
4.51798 |
0.0005 |
0.0001 |
|
2.95 |
2.95265 |
0.0009 |
0.0003 |
|
0.01 |
0.005208 |
0.0007 |
0.12 |
|
-2.22 |
-2.224521 |
0.0006 |
0.0003 |
The relative error in the model is only a few hundredths of a percent. The relative error for yo = -0.6 mm is greatly exaggerated because the final Y position is so small that even a small absolute error greatly affects the relative error. Note well that positions of less than 0.25 mm are below the detector’s resolution, so the exaggerated magnification error will not even affect the data analysis in an actual experiment. Therefore, the model also works well for determining the magnification of beam fragments when the spectrometer is used in focusing mode.
Conclusion
To determine the magnification of beam fragments, the general equation is
ym = (MYo * yo) + (MVy * VYi * TOF), where ym is the final, magnified Y position, yo is the initial Y position of the particle, VYi is the initial velocity of the particle, and TOF is the particle’s time of flight. MYo and MVy depend on what mode the spectrometer is used in and are given by the following equations:
1. For the nonfocusing spectrometer:
MYo = 1.17901 + 0.71252e -Escl/ 0.29618 + 0.91658e -Escl/ 1.7692
MVy = 1.02777 + 0.14667e -Escl/ 0.35555 + 0.14628e -Escl/ 1.72715
2. For the focusing spectrometer:
MYo = -0.13007*[e-2 * 2.34361*(Escl – 0.39028) – 2e-0.29663 * (Escl – 0.39028)] + 1.05528
MVy = 0.99362 + 0.0908e-Escl/ 6.23221 + 0.14413e-Escl/ 0.81316
The Escl in the equations is the initial energy of the particle beam divided by the voltage on the 5th plate of the spectrometer. This model, when coupled with the equations and conditions describing the action of the recoil ions, will allow us to analyze all the kinematic elements in particle breakup experiments performed with this spectrometer.