Minimizing Focal Averaging Using Hardware (Chop Chop Gauss!)
Maggie Liu, Carnegie Mellon University, Physics Major
Mentored by Dr. Cosmin Blaga
Motivation
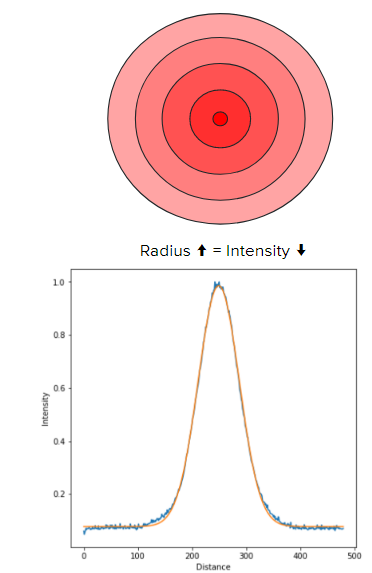
Although a laser is a highly-collimated beam, it's not perfectly homogenous. Directly shot at a camera, a laser beam cross-section shows up in layers, like an onion. The center of the laser is the most intense, and as the radius of the beam increases, the intensity decreases, forming a Gaussian profile.
Due to limitations of equipment, the data that we collect from lasers is focally averaged over all available intensities. However, as certain events (such as knocking an electron away from an atom) are only caused by certain intensities, we need to be able to isolate said intensities. Although we can do this post-experiment with software, we would like a way to isolate the needed intensities using hardware during the experiment.
Method
We used a helium-neon (HeNe) laser with a wavelength of 632nm and an 8-bit camera. Due to limitations on our technology, we used mirrors and a wedge prism to decrease the intensity of the beam so that the camera could pick up the signals without breaking, as well as to deflect the beam path because our optics table wasn't long enough.
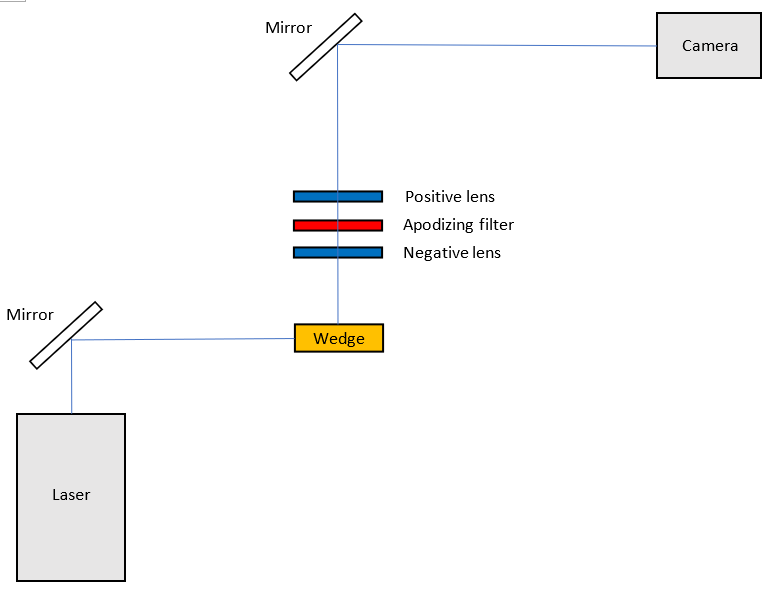
The lens setup consisting of a negative lens, an apodizing filter, and a positive lens was the heart of the experiment. The negative lens made the beam bigger, the positive lens focused the beam down, and the apodizing filter--a lens with a dot of silver in the middle--blocked the center of the beam to form an inverse Gaussian profile.
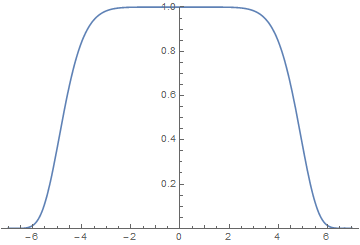
When the laser beam (with a normal Gaussian profile) goes through the apodizing filter, the camera should ideally pick up a flat-topped Gaussian profile, with said flat top corresponding to one specific intensity, subject to change according to the position of the filter.
Analysis
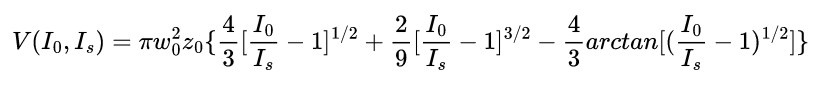
By moving the filter between the positive and negative lenses, we were able to take pictures of the laser beam at different filter positions, at the focus of the beam and around it. Then, we analyzed the pictures by loading them into a Python program, plotting the beam profiles, and finding the electron yield of each intensity that we're interested in. In order to find the yield of the experimental data, we multiplied the counts of the intensity we wanted with an ionization rate (here, we assumed intensity raised to the 6th power). For simulating theoretical data, we used quite a complicated equation to find the volume of the intensity peel, then multiplied it with the same ionization rate.
We then fit a Gaussian to both the theoretical and experimental data to find the full width half max (FWHM) of the curves -- this will tell us about the spread of the intensities ranges. In the end, the experimental data had a narrower range in intensity than the theory, which meant that the data was more focused around one particular intensity -- in other words, we successfully minimized focal averaging.
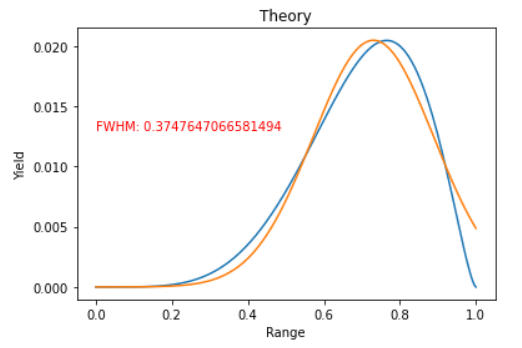
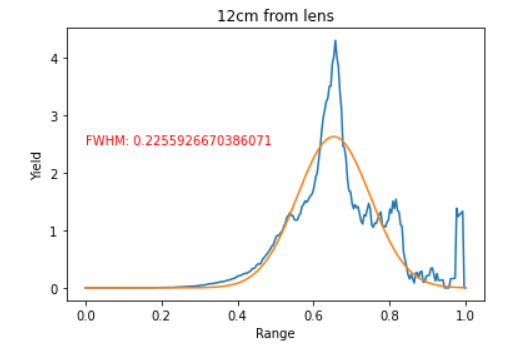 Fig. 6: Experimental data
When we compared the experimental and theoretical data to a simulated experiment, we found that a 'hump' in the simulation -- corresponding to only one particular intensity -- was closer to the experimental data than the theoretical data, further confirming that we had, indeed, been successful in narrowing down the intensity range of the laser using the apodizing filter.
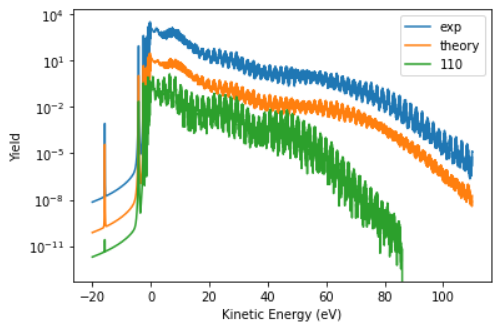
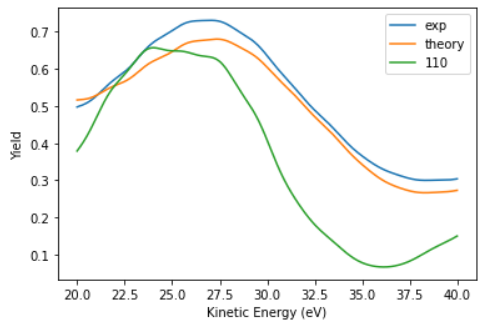 Fig. 8: Filtered photoelectron spectrum (note the distance of the peaks from each other)
Acknowledgments
I would to thank Professor Cosmin Blaga for being a wonderful mentor; Pavan Muddukrishna, Eric Mullins, and Sajed Hosseini-Zavareh for helping me whenever and with whatever I needed; Dr. Bret Flanders, Dr. Loren Greenman, and Kim Coy for making this experience the best it could have been; and Kansas State University and the NSF for funding this program. Lastly, I would like to thank my fellow REU participants for an unforgettable summer.