Simulating Amyloid Fibril Growth
Iris Horn, Haverford College, Physics Major
Mentored by Dr. Jeremy Schmit
My project this summer was to make a Monte Carlo simulation to model the growth of amyloid fibrils. My goal was to find a way to represent a transition from order to disordered growth.
Amyloid fibrils are a way that proteins aggregate that have a structure dominated by beta-sheets where proteins stack on top of one another in insoluble and stable chains. We are interested in studying these fibrils because they are present in many different diseases. For example, Parkinson’s Disease, Altzheimer’s Disease, Type II Diabetes, and many more. We are not yet sure if the fibrils are causing disease, unrelated or even acting as a defense mechanism against disease, but the hope is that understanding them more will help us understand the role they play and create a drug to target the fibrils if they are indeed harmful.
The factors that I accounted for in my simulation to model this growth are register, which is a measure of how aligned each protein is with the one below it, and the order of amino acids in a protein. Register is defined as how far the left end of an incoming protein is shifted relative to the left end of the one below it, so a protein with r=0 is completely aligned with the one below it.
Register is important because the more aligned the proteins are with one another, the more bonds can form between them. This means that in-register proteins are more likely to stay attached long enough for another protein to join the fibril and less likely to separate from the fibril. Proteins that are out-of-register also have a harder time forming bonds with proteins above them even if the incoming protein is completely in-register. The out-of-register protein has a “tail” hanging off the fibril that is unattached which don't start forming bonds again until three proteins are aligned at that point.
We simplify the properties of amino acids down to being either Hydrophobic or Polar. This is important because bonds between two hydrophobic amino acids(H-H) are strong and any other combination(H-P or P-P) is weak. The order of amino acids in the protein creates varying groups of strong bonds and weak bonds that affect how likely a protein is to stay attached or separate from the fibril. This means certain registers are more favorable than others.
When I incorporated these properties into my simulation I was able to see that the fibrils were selecting for proteins that are closer to being in-register at lower concentrations which we call ordered growth but eventually not able to do so as I pushed the concentration higher causing a shift into disordered growth. This is because when the concentration of proteins in solution is higher there is less time between when a protein attaches and when the next protein attaches because that time is only limited by how long it takes for a protein to reach the fibril. When there is less time between attachments, the proteins aren’t able to effectively complete their random search for favorable alignments. We can see this transition in Figure 1.
 Fig. 1: Graph of Growth Rate vs. Concentration generated by my simulation. Blue shows no difference between strong and weak bonds while Yellow - Red shows progressively stronger strong bonds and weaker weak bonds. Early Plateau in Red line followed by transition to more linear path shows ordered growth shifting into disordered as concentration rises.
We can see that this transition happens as the fibrils become less disordered and average register becomes higher in Figure 2 and see how ordered growth keeps average register near 0 in Figure 3.
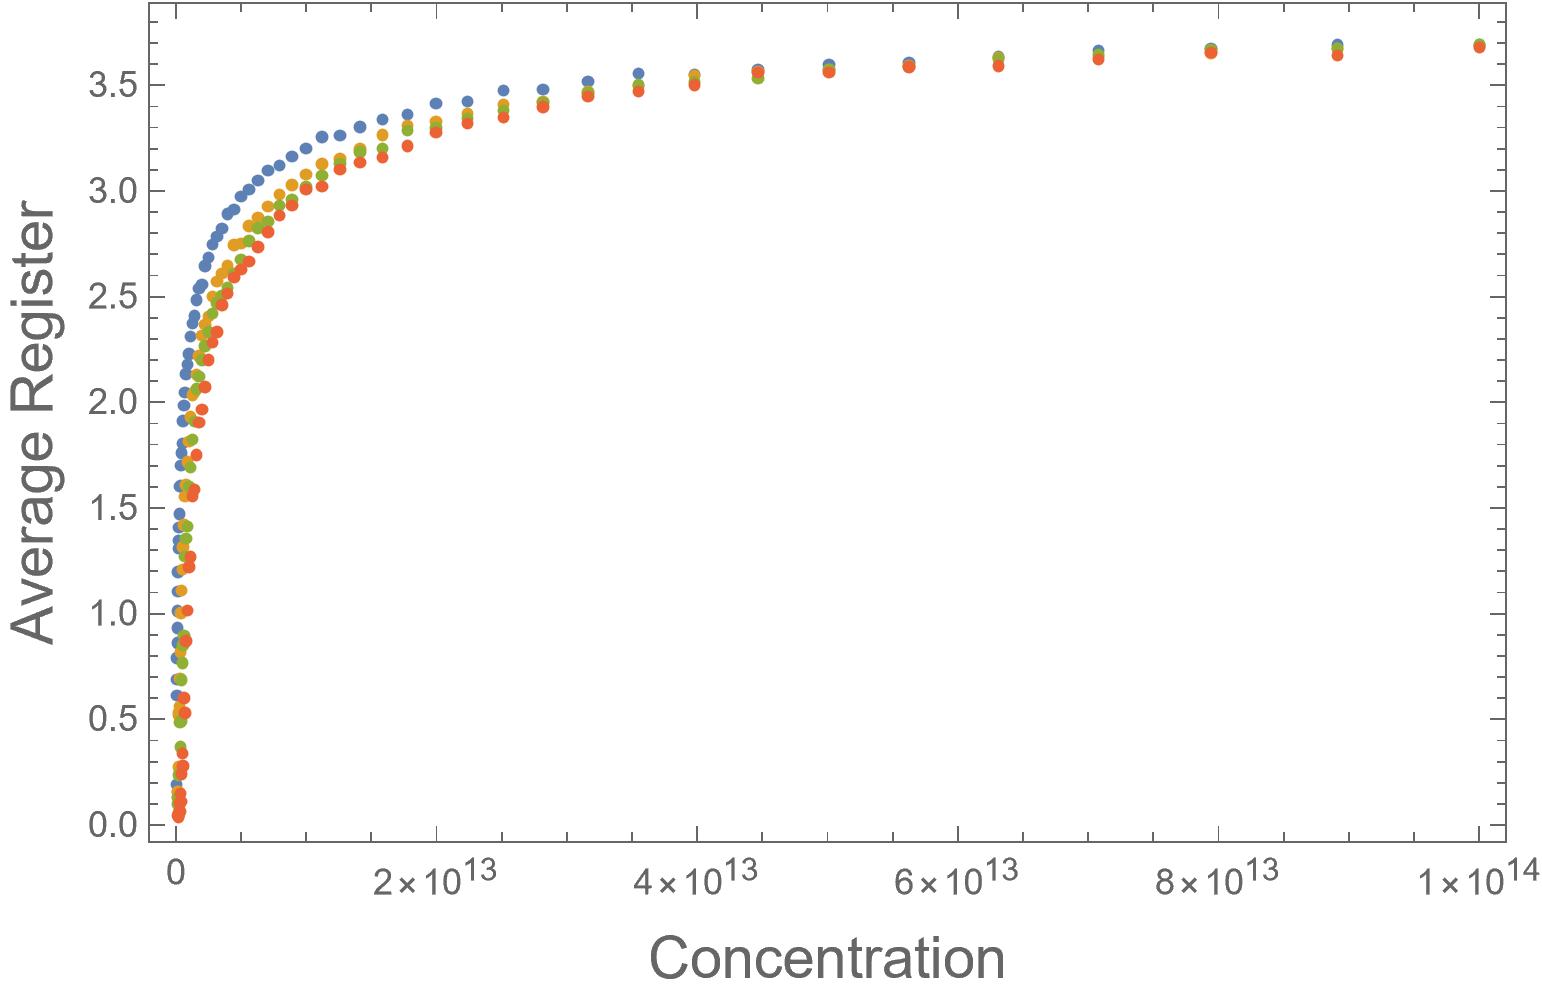 Fig. 2: Graph of Average Register vs. Concentration generated by my simulation. Blue shows no difference between strong and weak bonds while Yellow - Red shows progressively stronger strong bonds and weaker weak bonds. Converging of all lines as the average register reaches 3.5 shows when the growth of all fibrils becomes disordered (at the same point lines converge in Graphic 1).
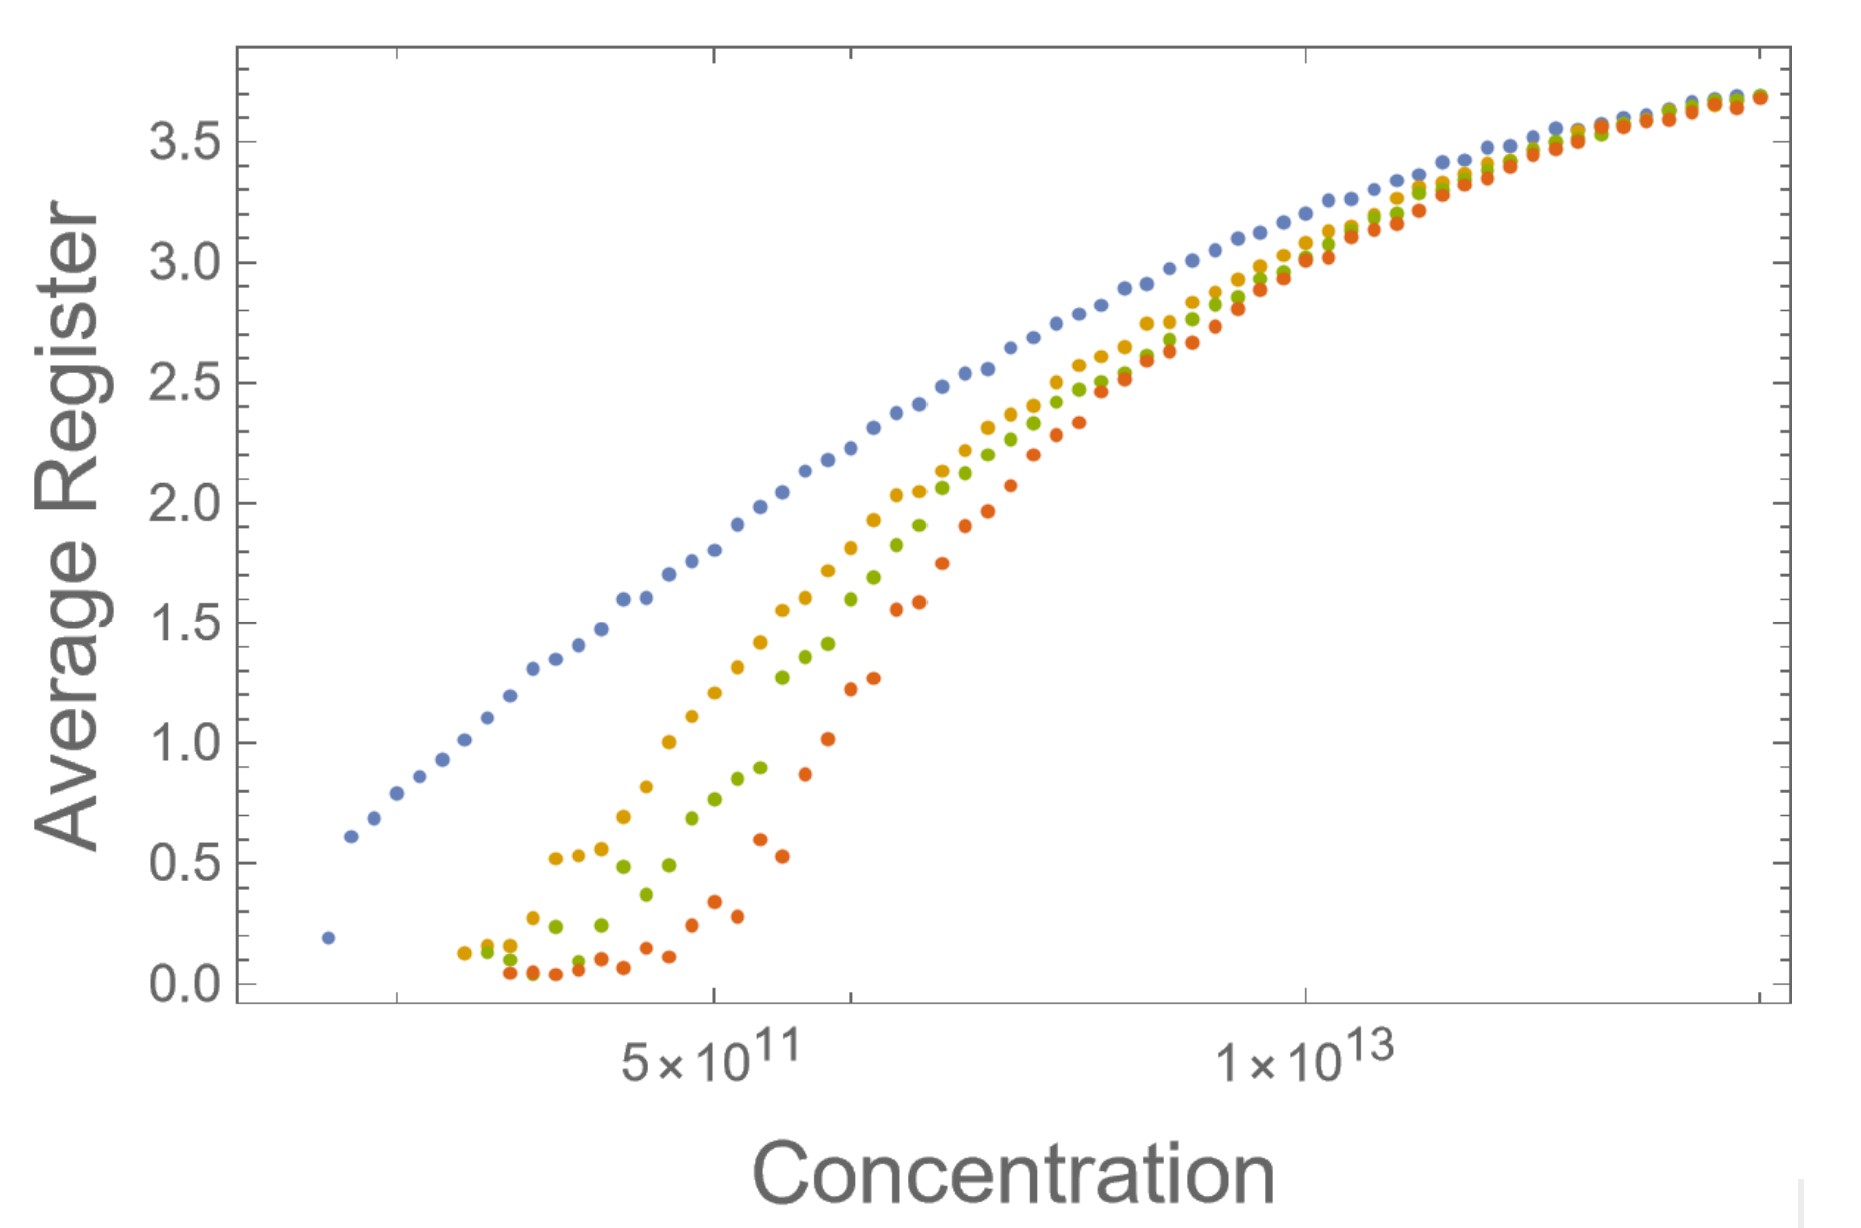 Fig. 3: Same data as graphic 3 but on a LogLinear plot. We can see the red line lingering with a register near 0 far longer than the other colors.
Throughout the summer I created different versions of my simulation, taking into account different factors in each, so that in the future we can look more into how different features of the fibrils affect their growth.
Acknowledgments
Firstly, I would like to thank my advisor, Dr. Jeremy Schmit, for helping me throughout the summer and giving me such a fascinating project to work on. I would also like to thank Dr. Bret Flanders, Dr. Loren Greenman, and Kim Coy for facilitating this REU and organizing activities and talks for all of us and the NSF for funding this program. Finally, I would like to thank my fellow REU students for being supportive and teaching me so much this summer.