Laser Beam Monitoring and Stabilization System
Sara Sayer, Louisiana State University, Physics Major
Mentored by Dr. Cosmin Blaga
Introduction
The goal of this project is to develop a Python program that monitors and stabilizes a laser beam used in an experiment. Things such as temperature, humidity, and vibrations in the room can all cause the beam to move off target, introducing unwanted variables to the experiment. This system is achieved by imaging the beam at constant time intervals, analyzing the beam profile, and motorizing the mirrors that direct the beam to its position. This technology exists commercially for thousands of dollars but this project demonstrates that the same functions can be achieved for a fraction of the cost using a RaspberryPi machine.
Goals
There are two main parts of this project: the “Laser Health Monitoring System” and the “Active Beam Pointing Stabilization System.” The purpose of the health monitoring system is to calculate and record information about the beam such as temperature, shape, and size. The stabilization system serves to keep the beam from drifting off target via a feedback loop, essentially creating a “smart laser.”
Methods
The Raspberry Pi 4 Model B is programmed to take images of a HeNe beam with the Raspberry Pi High Quality Camera in a user-defined time interval.
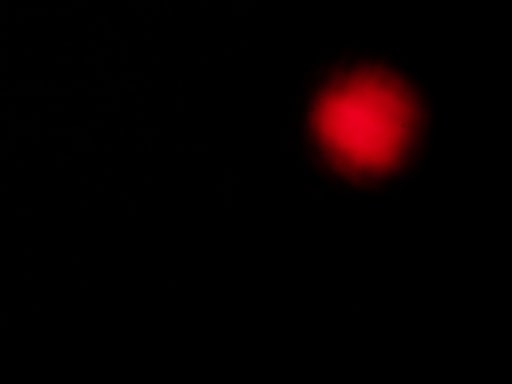
Fig 1. Image of the HeNe beam captured with the Raspberry Pi High Quality Camera.
One mirror is motorized with a Pololu Maestro Servo Controller that is used to stabilize the beam. The program reads in the image and creates a 2D array of the red pixel values. The center location of the beam can be found by summing every column and row of the array and finding the maximums. Next, the beam profile is analyzed by fitting a Gaussian profile to the horizontal and vertical lineouts.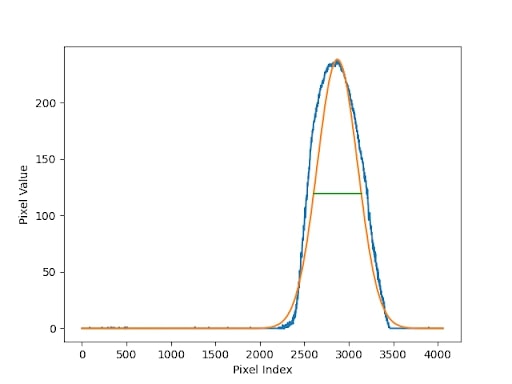
Fig 2. X profile of the beam.
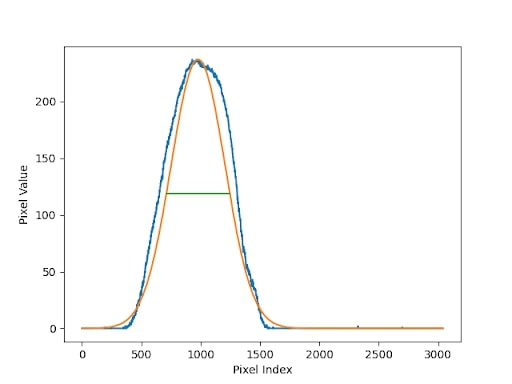
Fig 3. Y profile of the beam.
From this, the full width half max (FWHM) in the X and Y directions is calculated and can be used to find the beam diameter.
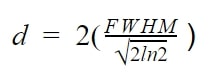
Fig 4. Equation to calculate diameter of the beam from FWHM found earlier.
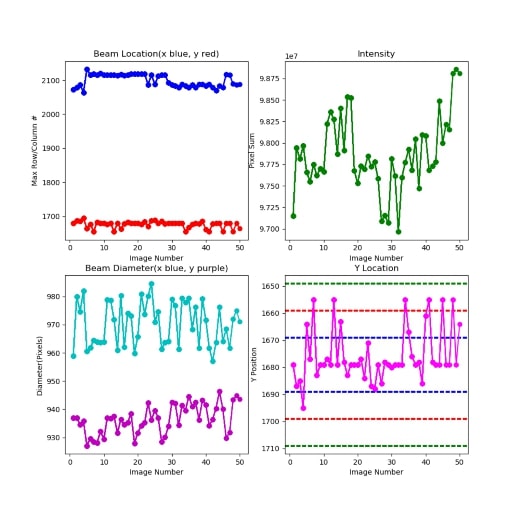
Fig 5. Working interface of the program.
The beam location plot displays both the X and Y location of the beam using the index of the maximum row and column found earlier. Next, the intensity of the beam is found by taking a subarray of the pixel readouts around the center of the beam with dimensions of 3FWHM(X) by 3FWHM(Y). The values of this subarray are summed to find the intensity. Then, the diameter of the beam in both directions is displayed. Finally, the Y location is displayed by itself to demonstrate the stabilization system. Currently, only one mirror exists in this setup, so only one dimension of motion can be controlled. When the first image is taken, the program “locks on” to the initial Y position and defines maximums and minimums that it tries to keep the beam within. In this example, the bounds are within ± 10, 20, and 30 pixels. If the beam is within 10 pixels of the target location, the mirror does not move. If it is between 10-20 pixels away, the mirror moves 1 click up or down, depending on which direction the beam needs to be pushed to put it back on target. For 20-30 pixels away, 2 clicks, and if the beam is more than 30 pixels away, 3 clicks. The upper and lower bounds for appropriate beam drift will depend on the user’s desired precision, and the adjustments by the mirror will depend on how far away the mirror is from the camera. For this setup, they were only about a foot apart, so 1-3 clicks was more than enough to keep the beam within bounds. To test that the stabilization system was actually functioning as intended, 3 runs were conducted that compared the average drift of the beam when the program was on vs. off. Fifty images were taken 10 seconds apart and the difference between the current position and initial position, in pixels, was taken. The average of the magnitude of these values corresponds to the average drift of the beam.
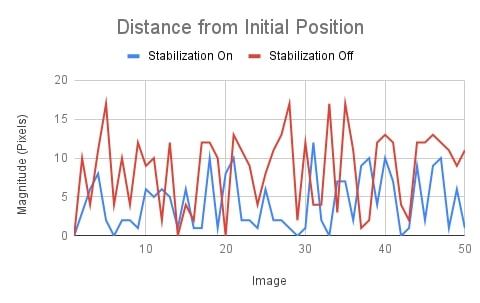
Fig 6. Run 1 of 3 comparing the drift from initial position when stabilization is on vs off.
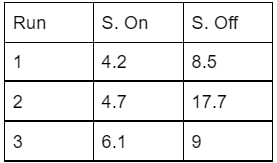
Fig 7. Results from all 3 runs.
The results show that the beam wanders, on average, significantly less from the initial position when the stabilization program is on.
Conclusions and Future Work
Laser beam monitoring systems exist commercially but can be recreated for a much smaller cost with the added benefit of being customizable and the stabilization program’s effectiveness can be practically demonstrated. In the future, we plan on having a fully interactive graphical user interface (GUI), automatically turning off the laser if it drifts off camera, as well as implementing an already existing temperature monitoring program. This system will be presented at the Symposium on Undergraduate Research at the DLS (Division of Laser Science, APS) meeting in November.
Acknowledgments
Firstly, I want to thank Dr. Cosmin Blaga for being a wonderful mentor. I would also like to thank Del Kanku who will be continuing work on this project after I leave and Dr. Daniel Rolles for organizing that Del and I work together. I am also grateful to Pavan Muddukrishna, Eric Mullins, and Sajed Hosseini-Zavareh for giving me advice, answering my questions, and helping with my final presentation. Additionally, thanks to Kim Coy, Bret Flanders, and Loren Greenman for organizing this program, as well as Kansas State University and the National Science Foundation for funding the program.