Simulating F-Actin and Filamin using the Metropolis Monte Carlo Algorithm
Terry Salava Jr., Emporia State University, Physics and Math Major
Mentored by Dr. Jeremy Schmit
This summer I was able to work with Dr. Jeremy Schmit in the field of biological condensed matter physics. My main focus of this project was to create a Monte Carlo Simulation of the proteins F-actin and Filamin. F-actin is a protein that forms a long rod-like structure with many bonding sites. Filamin is a flexible protein and only has two bonding sites. The two proteins when mixed will form bonds like in figure 1. When the two proteins are mixed in sufficiently high concentrations, they form droplets in the solution with the shape of a football as shown in figure 2. The football-shaped droplet has an aspect ratio (L/r) which is dependent on the concentration of the two proteins. The goal of the simulation is to measure L/r as a function of simulation factors such as bond energy, concentration, and length of the proteins. We can then relate the aspect ratio to the internal structure of the droplet within the simulation. Being able to measure the internal structure of a liquid protein is important because the current methods for measuring a protein's structure is to crystallize it, then measure it. The protein droplets could not be analyzed this way because they are in the liquid state and the structure would change if it were crystallized.
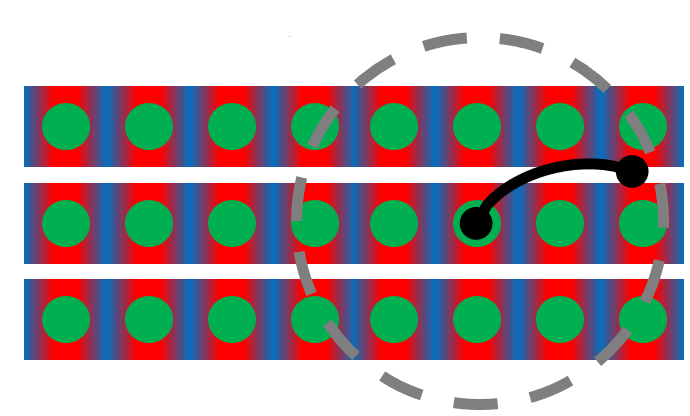
Figure 1: The colored protein is represents F-actin and the black protein is represents Filamin. The grey line shows the reach of the second bonding site of Filamin. Image made by Kamal Bhandari and Jeremy Schmit
![Figure 2: This figure shows the difference between the aspect ratios with different concentrations of the crosslinker filamin. Image taken from “Liquid Behavior of Cross-Linked Actin Bundles” Weirich et al [1]](/images/reu/2019/salava/fig2.PNG)
Figure 2: This figure shows the difference between the aspect ratios with different concentrations of the crosslinker filamin. Image taken from “Liquid Behavior of Cross-Linked Actin Bundles” Weirich et al [1]
I created 2 different simulations through the course of the REU: a simplified simulation, and a more accurate but complex simulation. The simple simulation that I started with was a single protein simulation containing only the F-actin with implicitly simulated Filamin. The way this simulation would form bonds is by edge interaction so if two proteins were adjacent they would be bonded. The proteins are located on a three-dimensional lattice and all of the proteins were facing the same direction for simplicity. The simulation also kept the number of proteins fixed since we did not need to change concentration for the simple simulation. We also had periodic boundaries for the simulation to keep the constant concentration and volume. The data that we collected from this basic simulation showed us that we would indeed get a football-shaped droplet from the entropy and energy balance of the system. Figure 3 shows what the aspect ratio of one-run would look like over the time of the simulation. Figure 4 shows how the average aspect ratio of an individual run would compare to other runs with a different energy.
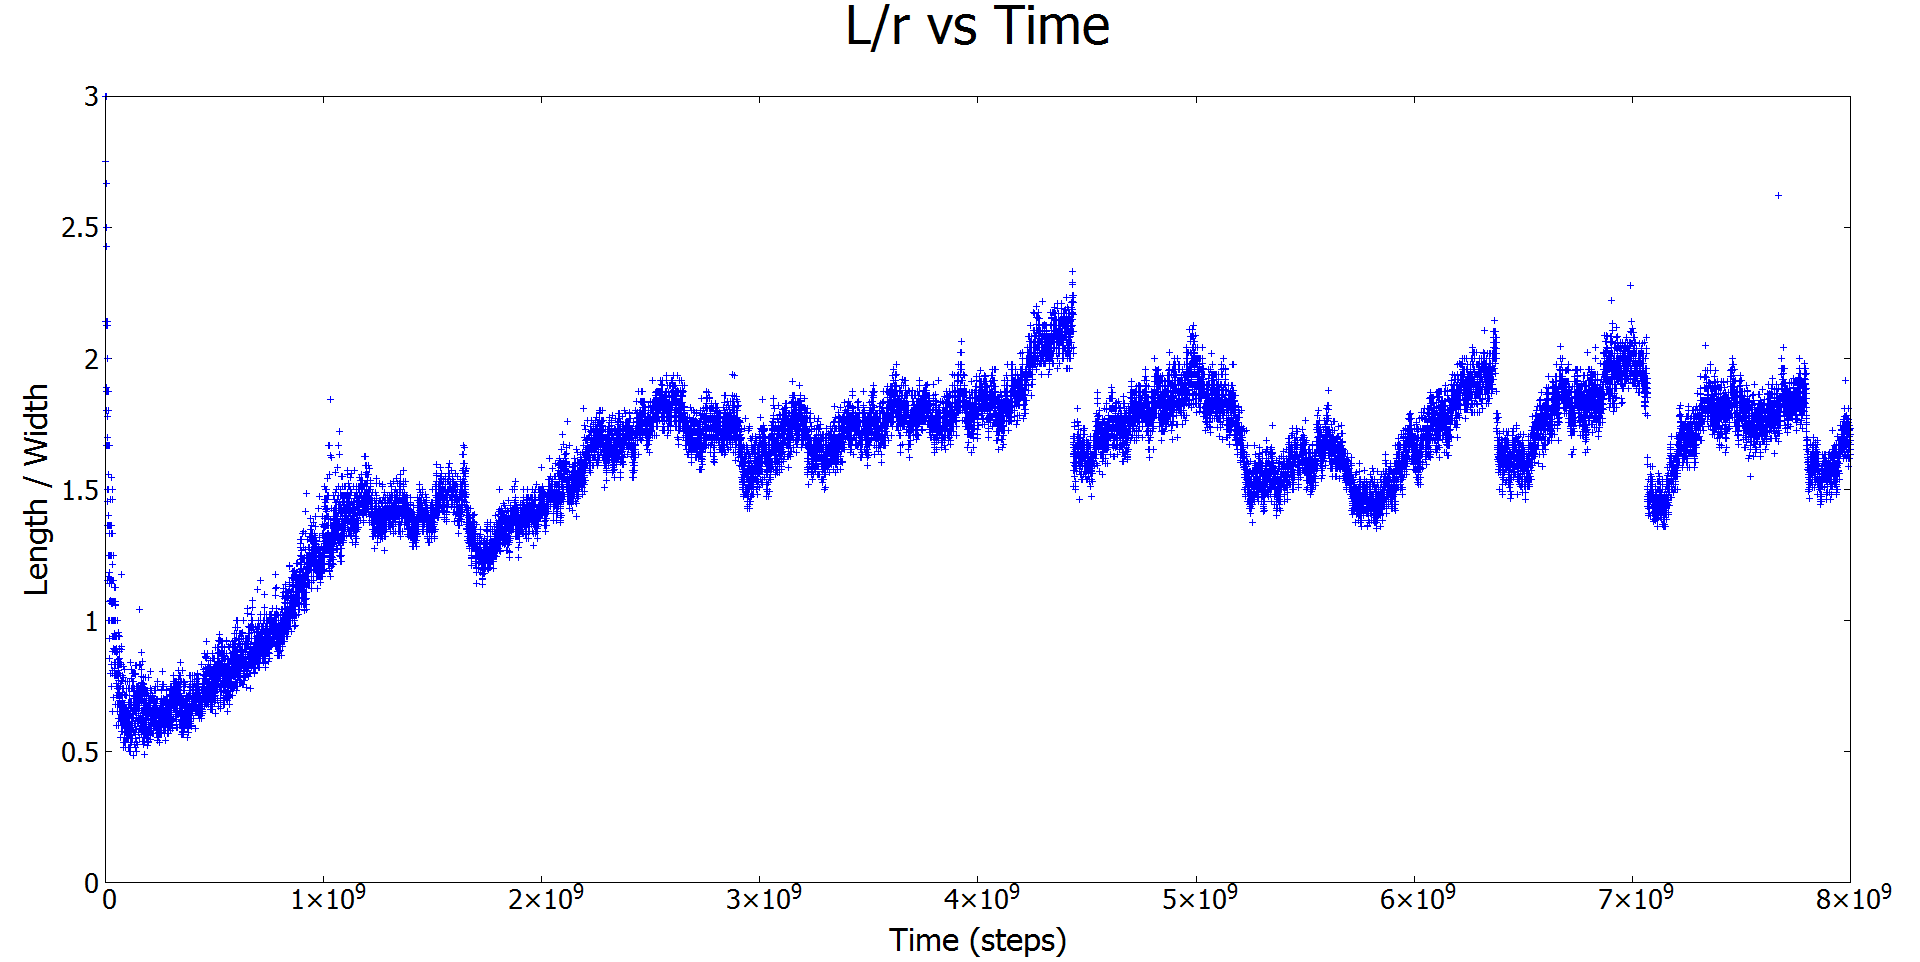
Figure 3: Plot of the aspect ratio vs time in Monte Carlo time steps. The sudden splits around 4.3x10⁹ and other spaces are when one droplet splits into two smaller droplets.
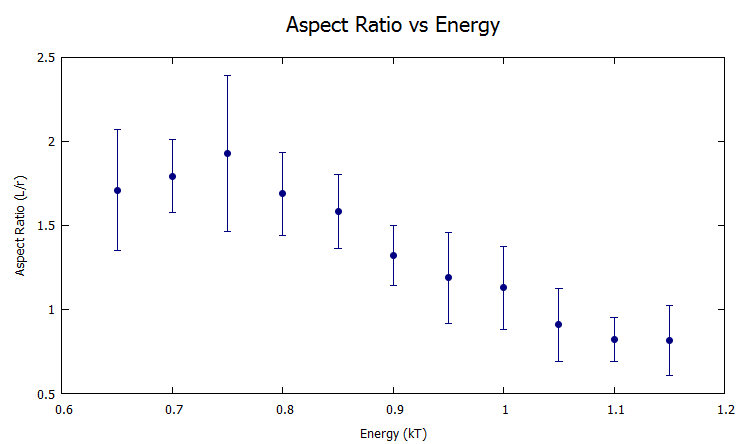
Figure 4: A plot of the aspect ratio vs energy. As the energy increases the, the aspect ratio decreases because the entropy of the system is less influential.
With smaller bond energy, the entropy of the system takes over and the system prioritizes movement over less free energy. The opposite is true of high bond energy where it prioritizes having every bond filled rather than having the freedom to move. In figure 4 anything less than 0.65 kT was too weak to create a droplet and the proteins would float around freely in solution. Figure 5 is an example state of the simulation with 0.8kT bond energy.

Figure 5: This is a snapshot if a single protein simulation with 0.8 kT bond energy 6x10^9 moves in the Monte Carlo Simulation. There are many proteins floating around due to the entropy of the system but most of the proteins are in the droplet because its more energetically favorable.
The 2 protein simulation is not much different than the first except with the explicitly simulated Filamin. In this simulation, I have 2 lattices, one for F-Actin and one for Filamin. The only way that these proteins could make bonds is by occupying the same X, Y, Z coordinates at the same time for their respective lattices. Filamin, however, has a different moveset than F-actin because it can enter and exit the simulation. The energy calculation function was slightly modified to account for the chemical potential from the change in Filamin. Although I was able to write the program for this simulation, I was unable to run the simulation due to the time needed to finish. One reason for this is the much higher energy values needed to perform the simulation. The higher energy needed to get the proteins to cluster increased the simulation time to 3 weeks or more depending on energy, concentration, or length.
References
Acknowledgments
I would like to thank my mentor Dr. Jeremy Schmit and Tian Phan for their amazing support with the project. I would also like to thank Dr. Bret Flanders and Dr. Loren Greenman for organizing the REU. Finally I would like to thank K-State for hosting the REU and the National Science Foundation for the funding.