Generation and Characterization of Lower Harmonics
Zane Phelps, Kansas State University, Physics Major
Mentored by Dr. Daniel Rolles and Dr. Artem Rudenko
For pump/probe or “molecular movie” experiments we need short femtosecond pulses. One pulse is used to start chemical reactions (pump pulse) and the other ionizes the molecule (probe pulse). To trigger certain photo-chemical reactions light in the visible or ultraviolet wavelength range is required. It is not easy to build a femtosecond laser that directly generates light in the visible or ultraviolet. Typically, people use nonlinear optics to convert the source beam in the near-infrared to visible or ultraviolet light. For this project we convert our source in the near-infrared (800nm) to its fourth harmonic (200nm) using a combination of barium borate (BBO) crystals.
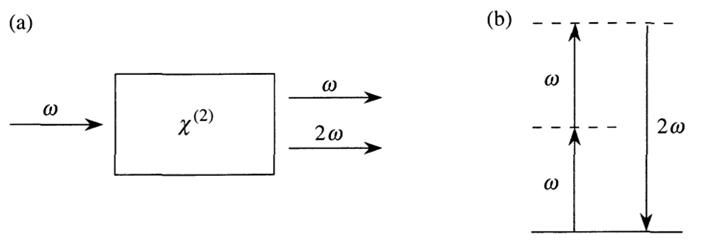
Fig. 1. These Harmonic frequencies come from the higher order terms in the polarization. The polarization expands as a power series in E-field: P = χ(1)E + χ(2)E2 + χ(3)E3 + …, Where χ(i) is the i-th order susceptibility. Higher order polarization terms give “harmonic” frequencies at ω, 2ω, 3ω etc. One method of generating these harmonic terms is by transmitting into a material with a large amount of higher order susceptibility. The material absorbs multiple photons from the source beam to emit a photon with a higher frequency.
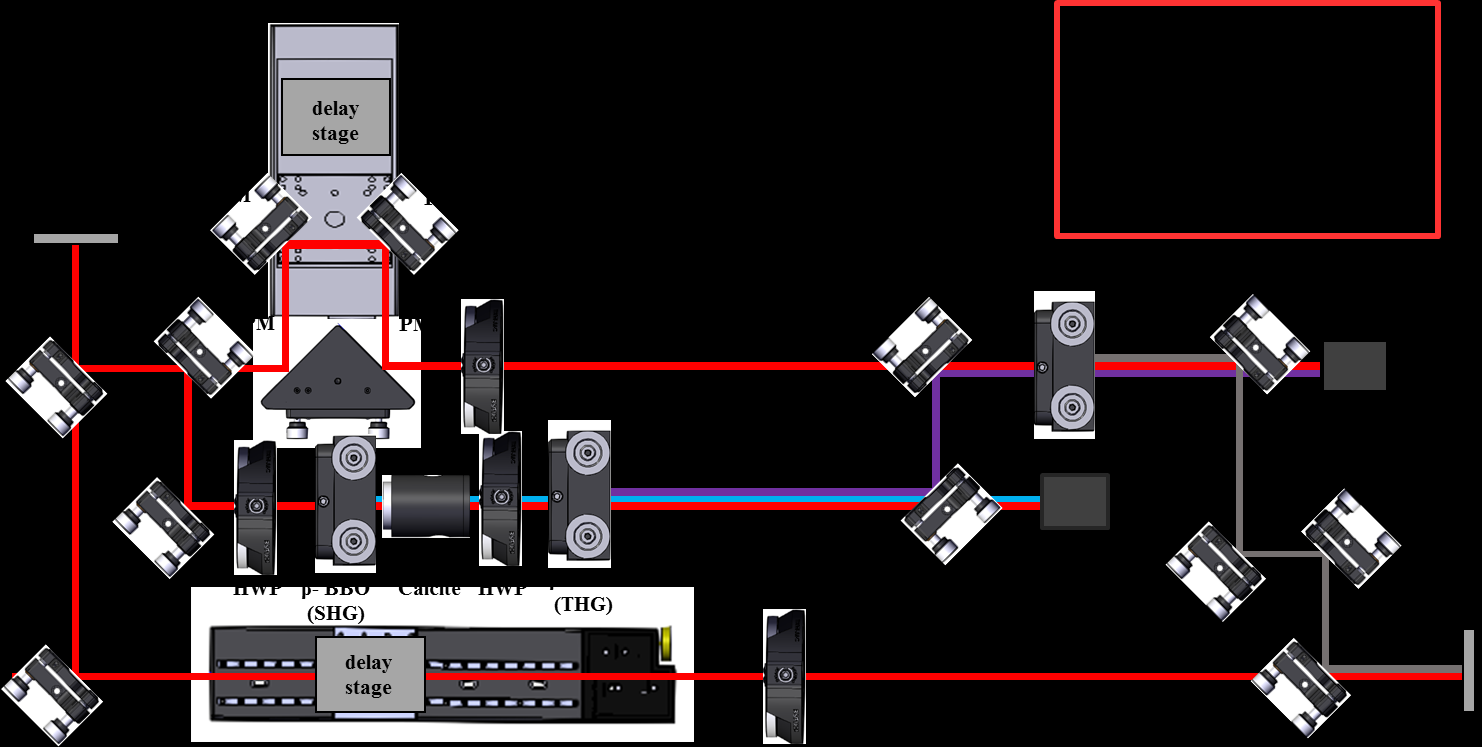
Fig. 2. In this diagram, we show the optical setup for our fourth harmonic generation. Initially we split the beam into an arm that will be for harmonic generation (pump arm), and a probe arm. The beam is then split again into a third harmonic generator and an interferometer with a mechanical delay stage. We then recombine the beam with the third harmonic source in another BBO to generate our fourth harmonic. After generating the fourth harmonic, we run it through several filters to remove other wavelengths and then recombine our harmonic with the probe arm to run pump/probe experiments in COLTRIMS (Cold Target Recoil Ion Momentum Spectrometer).
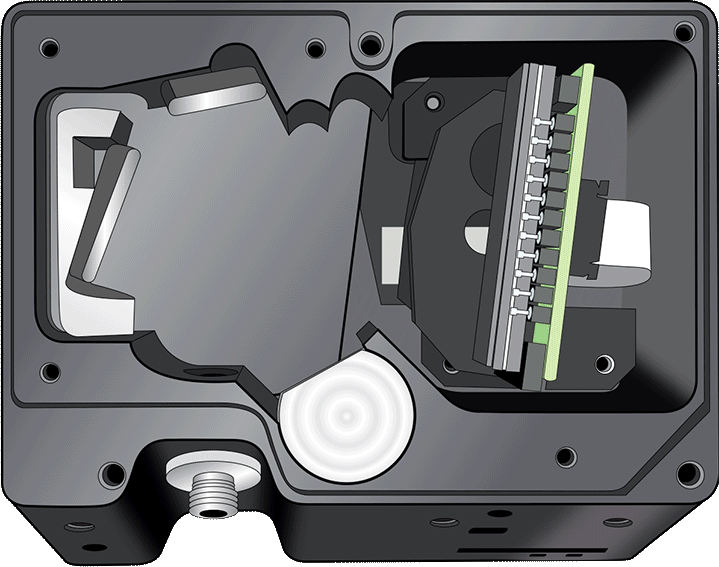
Fig. 3. To characterize the output of our laser, we use a miniature spectrometer. This spectrometer produces a spectrum that relates relative intensity to wavelength. For our specific spectrometer, the manufacturer recommends wavelength recalibrations yearly to maintain accuracy. We decided that we needed to check our calibration because the measurements from the spectrometer were consistently off compared to reference values.
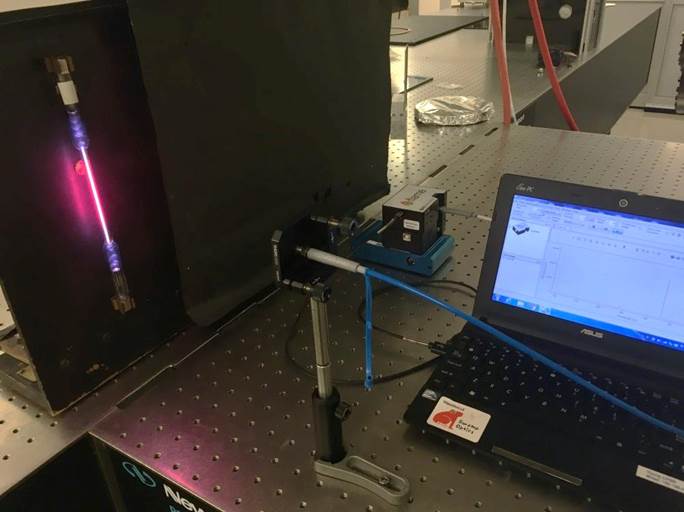
Fig. 4. The process of recalibration involves taking spectrum measurements with the spectrometer and comparing the peak values of the absorption lines with the peak values of a reference (NIST). For recalibration I took the spectra of several elements and plotted the difference in wavelength vs wavelength. This type of plot allows to see how off a measurement was at a given wavelength.
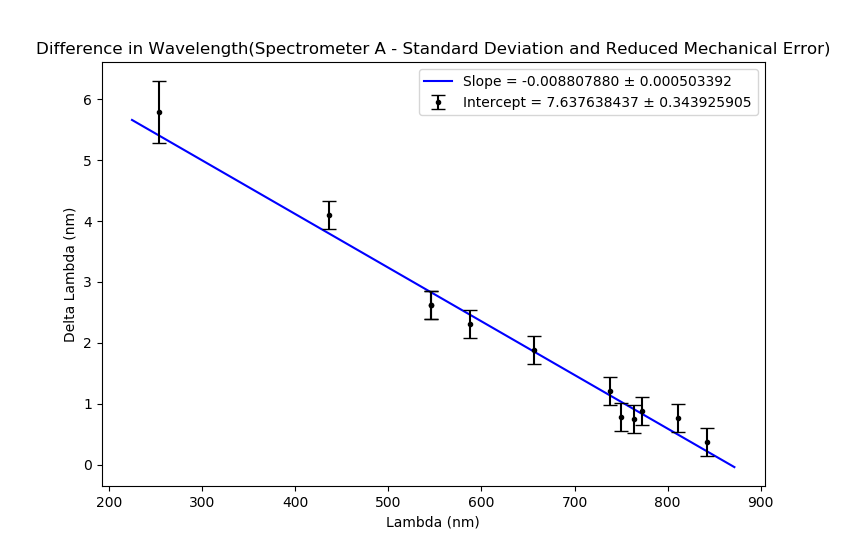
Fig. 5. For this plot, the difference in wavelength was averaged and plotted with standard deviation and mechanical error (the error associated with the size of the pixels in the spectrometer). This result showed that the spectrometer clearly needed recalibration and would not be sufficient to give any wavelength information for our fourth harmonic at 200nm.
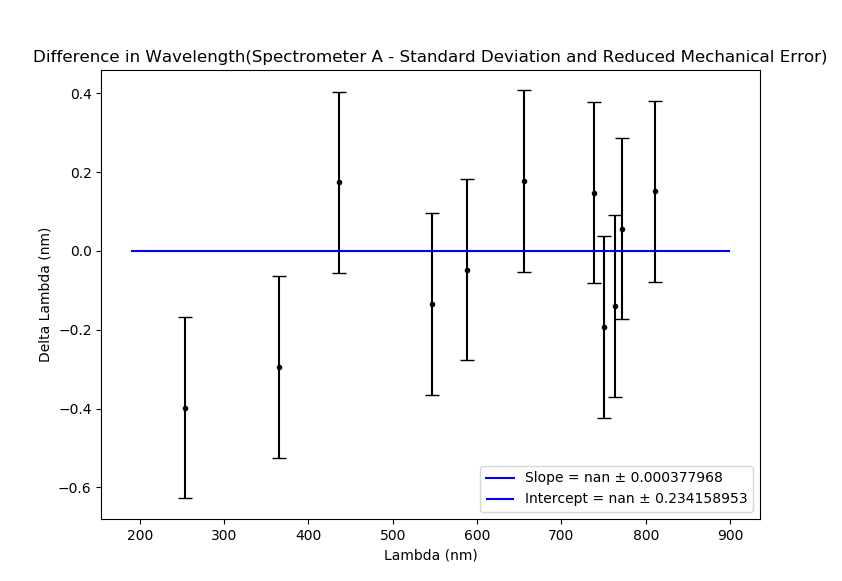
Fig. 6 After recalibration the difference and wavelength plot is close to being centered at zero. The line plotted is a reference at zero. The variance of each peak being ±0.1 - 0.3 nm is to be expected because it is similar in the factory calibration.
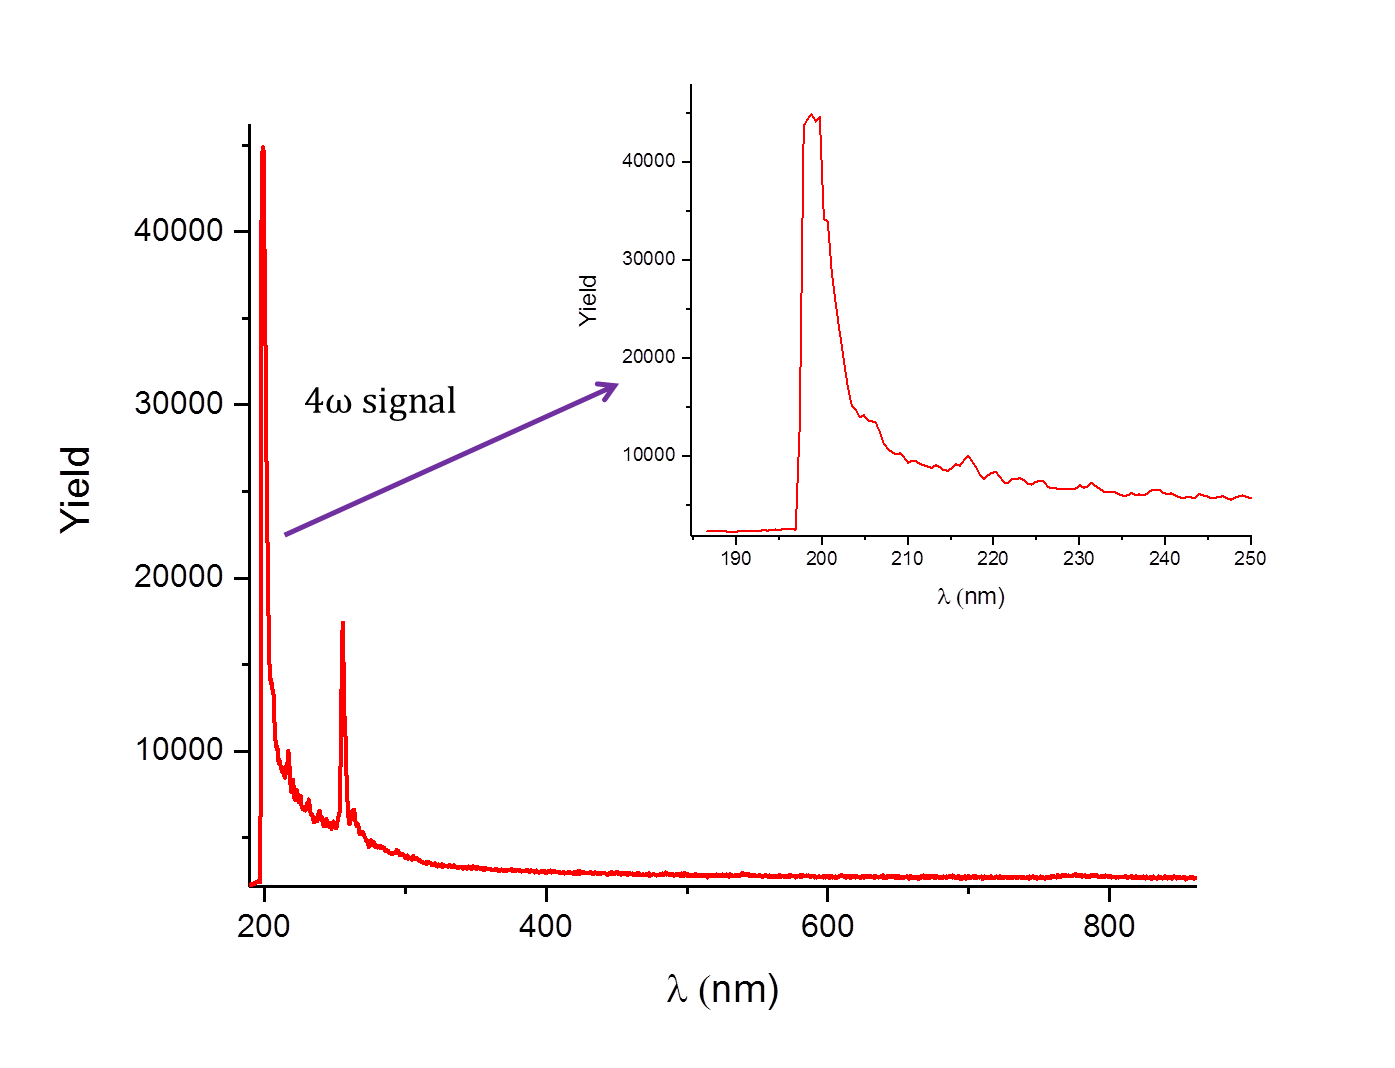
Fig. 7. After setting up the beam path for the fourth harmonic generation, we were able to successfully generate our fourth harmonic beam. This spectrum was measured prior to the spectrometer being properly calibrated so the wavelength information is not accurate. Looking closer at the peak we see that the peak is partially being absorbed, so we cannot use this spectrum to characterize the beam. In future beam-times, we plan to use other methods to characterize our fourth harmonic signal, and test the source in a COLTRIMS experiment.
Acknowledgments
Advisors Dr. Daniel Rolles and Dr. Artem Rudenko; Graduate Students Farzaneh Ziaee and Kurtis Borne; REU Advisors Dr. Bret Flanders and Dr. Loren Greenman; the National Science Foundation, the James R. Macdonald Laboratory and Kansas State University.