Analysis of Three-Body Breakup of Formic Acid Induced by a Strong Laser Field
Isabelle Maxwell, Willamette University, Physics Major
Mentored by Dr. Itzik Ben-Itzhak
This summer, I worked with Dr. Itzik Ben-Itzhak's research group under Travis Severt on analyzing the fragmentation dynamics of formic acid. Our experiment is essentially an example of an inverse problem, which involves looking at the final outcomes or experimental data and working backwards to learn something about the initial conditions. This is commonly used in medical imaging, for example in an EEG, or Electroencephalogram, which works inversely to determine the source of an electric signal from the brain. In this project, we are working backwards from measured asymptotic momentum of molecular fragments after the point of ionization to determine dynamics leading to fragmentation.
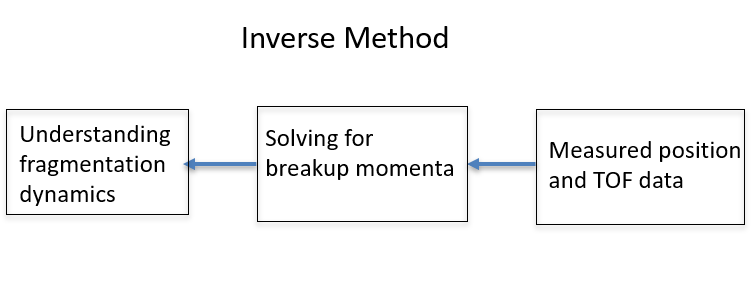
Figure 1.
The fragmentation processes we looked at were sequential and concerted. In concerted fragmentation, all bonds break simultaneously. In sequential fragmentation, bonds break in a stepwise way which results in some intermittent molecule forming. This intermediate molecule may have a dipole which interacts with the first fragment to come off. As a result, the intermediate molecule then starts to spin and gains angular momentum before its bond eventually breaks.
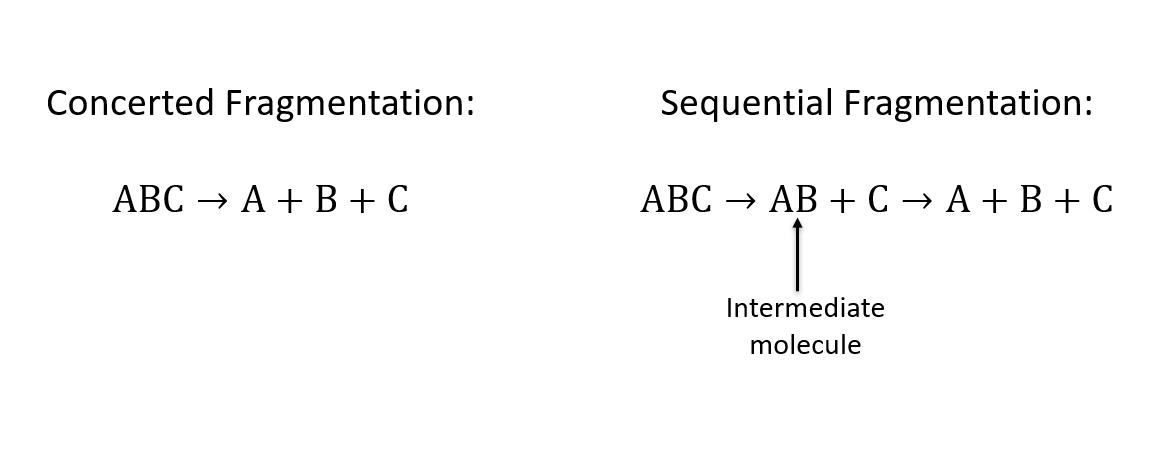
Figure 2.
To identify sequential fragmentation, we use the Native Frames Method plotting KER, or kinetic energy release of the intermediate molecule, versus some angle theta. Figure 4 plots this for the fragmentation of Carbonyl Sulfide, or OCS, in the case of Sulfur coming off first. The angle plotted along the y axis is the angle between the relative momentum vectors shown in Figure 3. We identify signatures of sequential fragmentation as the uniform angular distribution in the red gated region of the graph where the intensity of counts is constant.
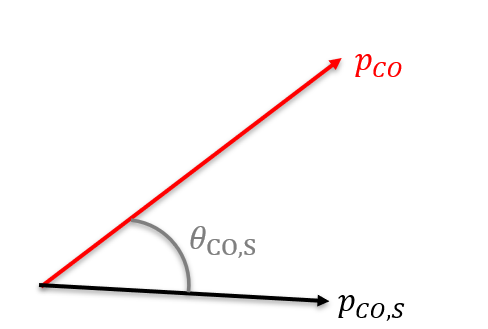
Figure 3. The black vector represents the relative momentum vector between the intermediate CO molecule and S+ when the S+ breaks off. The red vector represents the relative momentum vector between the C+ and O+ when the intermediate molecule breaks.
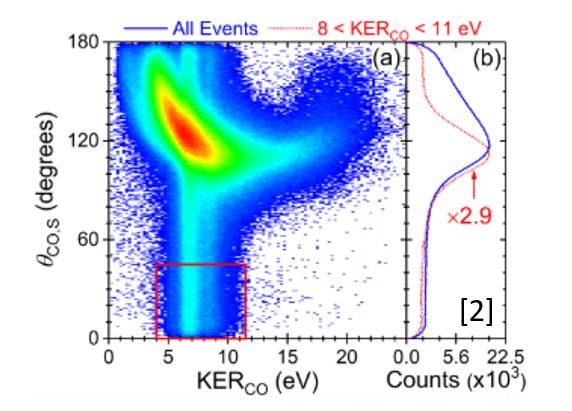
Figure 4. Native Frames plot of OCS to O+ + C+ + S+ yield as a function of (a) KER and the angle theta (b) The angle theta
T. Severt, et al., Native frames: A new approach for separating sequential and concerted three-body fragmentation (2019)
We measure the momentum of each fragment using an experimental method known as COLTRIMS, or Cold Target Recoil Ion Momentum Spectrometry. In this method, an energy source (in our case, a pulsed laser) is applied onto a jet of molecules which causes the ionization. Then, an electric field accelerates the ions to our detector which records the position and time of flight of each charged fragment. This is the inverse part: we use equations convert the position and time of flight data to initial breakup momenta of each fragment.
![COLTRIMS Experimental Apparatus. COLTRIMS. Digital Image. From [Roentdek.com, http://www.roentdek.com/Coltrims/]](/images/reu/2019/maxwell/fig5.png)
Figure 5. COLTRIMS Experimental Apparatus. COLTRIMS. Digital Image. From [Roentdek.com, http://www.roentdek.com/Coltrims/]
The molecule that we chose to study is formic acid, or HCOOH, because it has many possible breakup channels that would include sequential fragmentation. An example of a three body channel with sequential fragmentation is H+ + HCO2(2+)+ to H+ + CO+ + OH+.
![Formic Acid Chemical Structure Formic Acid digital image Quora. 4 July, 2019, from [https://www.quora.com/What-is-the-formula-of-methanoic-acid]](/images/reu/2019/maxwell/fig6.png)
Figure 6. Formic Acid Chemical Structure Formic Acid digital image Quora. 4 July, 2019, from [https://www.quora.com/What-is-the-formula-of-methanoic-acid]
Before analyzing three-body channels, we looked at two-body channels. The only two-body channel we were able to observe clearly was OH+ + HCO+. Figure 7 is a coincidence time of flight plot, which plots counts as a function of time of flight of the first and second fragments. We observe this channel as a clear and sharp diagonal line due to momentum conservation.
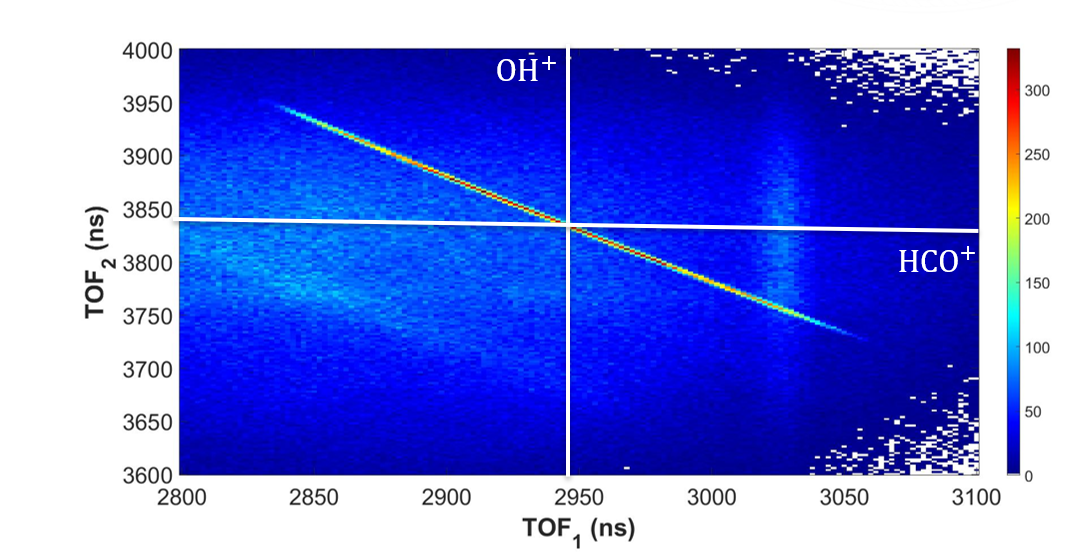
Figure 7. Coincidence Time of Flight Plot of OH+ + HCO+
Although we saw hints of some two-body channels, we were not able to clearly identify any. The cause of the lack of channels is visible in Figure 8, which plots counts as a function of position in the X and Y directions of each of the fragments of the identified OH+ + HCO+ channel. There is a 20 mm hole in the center of the distribution, which is where no fragments can be identified. This hole is along the direction of the polarization of the laser, which is where we would expect many channels to likely fall. Therefore, this hole is why we are unable to observe any other channels.
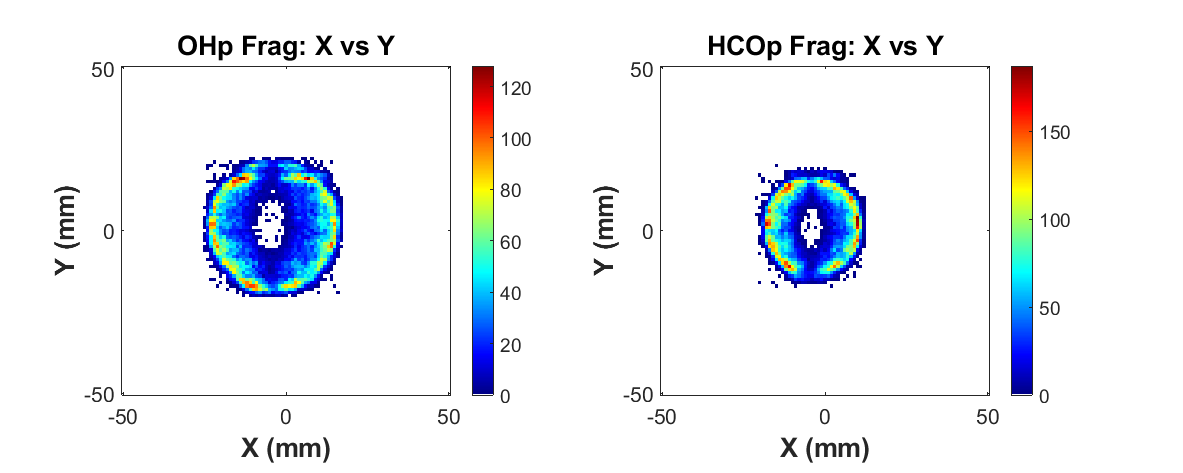
Figure 8. Counts as a function of position of both of the fragments in the OH+ + HCO+ channel.
We took data from Wang et al.'s paper on formic acid and digitized their data to compare it to our own data. We used a Monte Carlo simulation to convert their angular and KER distributions to N(x,y) lists of events, to compare to our data. The red dots correspond to the channel OH+ + HCO+ which was the same channel we identified in our own experiment.
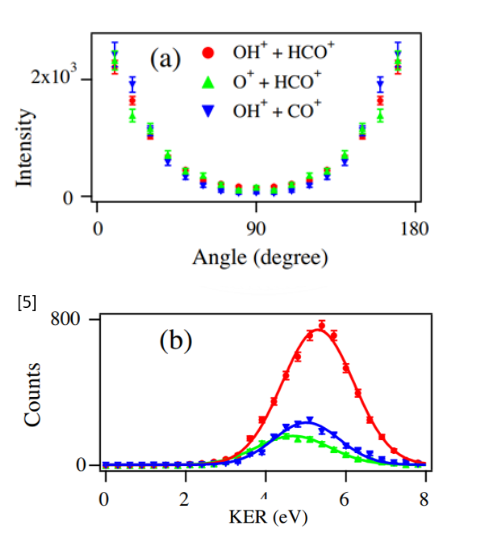
Figure 9. Angular distribution and KER distribution plots adapted from Wang. et. al. C. Wang et al., Chem. Phys. 430, 40 (2014).
We then evaluated relative efficiency of our set up as a function of position on the detector. In Figure 10, it is visible how inefficient the detector is, with the green section having an efficiency of only about 1%. In the regions with such low efficiency, most counts are lost, making it difficult to measure any other channels.
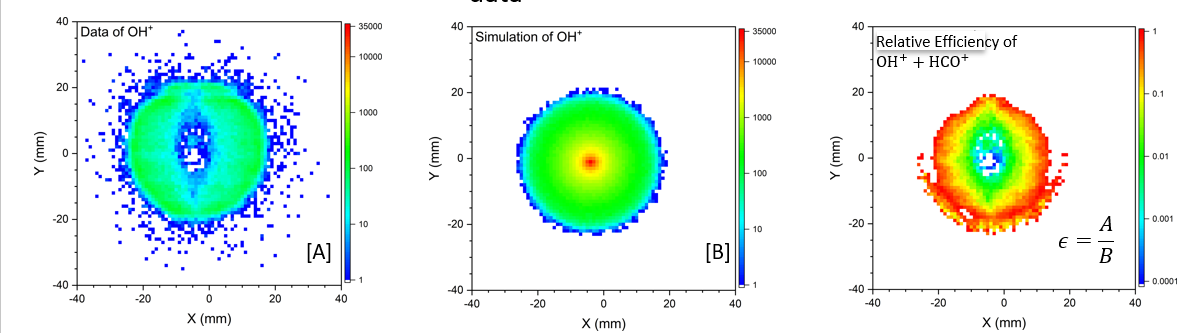
Figure 10. The first plot shows our data as counts versus position versus and the second is the data based on the KER and angular distributions data from Wang et. al. The third graph is relative efficiency, calculated by dividing our data by their data, i.e. by using A/B where A is our data, B is the simulated experimental data, and is the relative efficiency.
In conclusion, this efficiency calculation method could be repeated for similar experiments. All that is necessary is another experiment's data to compare to. In order to successfully perform this formic acid experiment again, it would be necessary to use a detector with uniform distribution such as the new detector that was recently installed.
Acknowledgments
Dr. Itzik Ben-Itzhak, Travis Severt, Dr. Daniel Rolles, Dr. Artem Rudenko, Farzaneh Ziaee, Kurtis Borne, Dr. Loren Greenmen, Dr. Bret Flanders, National Science Foundation, Kansas State University, James. R. Macdonald Laboratory, U.S. Department of Energy