Ion-Electron Coincidence Study of Thiophenone
Rebecca Fitzgarrald, University of Nebraska - Lincoln, Physics and Math Major
Mentored by Dr. Daniel Rolles and Dr. Artem Rudenko
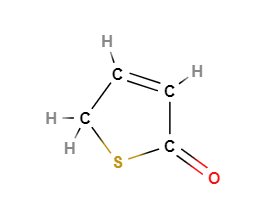
Figure 1: Thiophenone is a ring molecule whose ring-opening dynamics have often been studied.
We used coincidence spectroscopy to extract the photoelectron energies corresponding to specific photoions so that we can eventually identify the fragmentation pathways associated with the removal of an electron from a given molecular orbital. A double-sided Velocity Map Imaging (VMI) spectrometer was used to collect the data. In the set-up, the molecular beam is perpendicular to the XUV beam of photons that kick out electrons, causing the atoms in the molecule to gain positive charges. Coulomb forces push the pieces apart, and the molecule breaks, sending electrons to one detector and the ions to another. We collected information on their time of flight (TOF) as well as their positions on the detector.
![Figure 2: Diagram of the double-sided VMI Spectrometer used in our setup, with the molecular beam in red. [1]](/images/reu/2019/fitzgarrald/fig2.png)
Figure 2: Diagram of the double-sided VMI Spectrometer used in our setup, with the molecular beam in red. [1]
The spectrometer also lets us measure the ions and electrons in coincidence, so we know which ones came from the same molecules. The data was collected at the Advanced Light Source at Lawrence Berkeley National Laboratory during a week-long beam time.
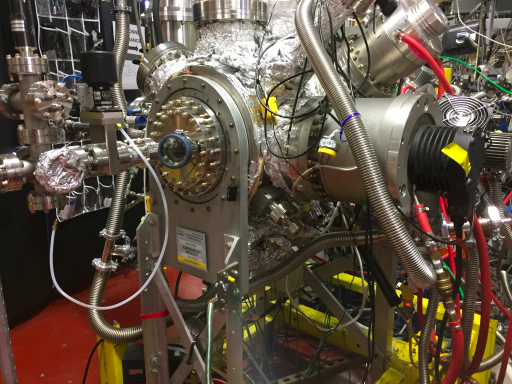
Figure 3: Chamber used to collect data at the Advanced Light Source at Berkeley National Lab.
Once we gathered the data, we began by identifying the TOFs of the different ions that we recorded, since the molecule has several different fragmentation pathways.
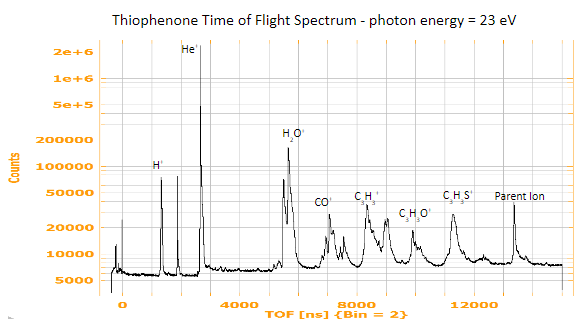
Figure 4: TOF spectrum for thiophenone, which helps us identify ions by their time of flight.
We then focused on the electrons that corresponded to those specific ions. Using Velocity Map Imaging, we were able to assign a kinetic energy value to each distinct ring of electrons that reached the detector, as each radius had a particular energy associated with it.
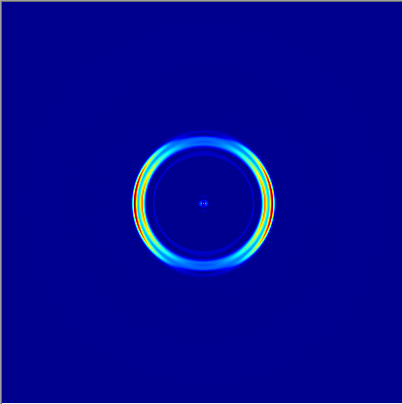
Figure 5: Electron rings associated with H2O. Two rings can be seen, corresponding to two different kinetic energies from two separate molecular orbitals.
We used argon and helium as calibration gases to find the calibration factor that associates each radius with kinetic energy since we know their binding energies and thus the kinetic energies their electrons should have for a given photon energy, as the kinetic energy is the difference between the photon energy and the binding energy. We then circularized the electron images corresponding to the fragments we wanted to study by first reflecting the upper left corner of the image across the axes, so the image was symmetric, and then we used a circularization algorithm to circularize that image. We then inverted it by reconstructing the 3-D electron sphere from the 2-D image and took a slice of that sphere to get sharp, distinct lines to improve our energy resolution.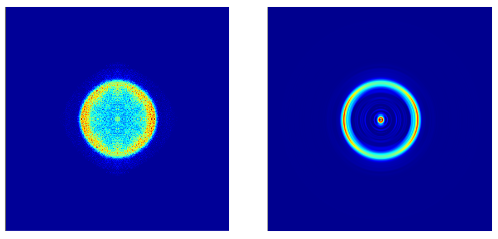
Figure 6: Circularized image of electrons associated with C3H3O (left) and inverted image (right). The inverted image is akin to taking a slice from the center of the 3-D sphere of electrons that was emitted from the molecule when the laser pulse ionized it. This creates much sharper lines and improves the energy resolution.
For each fragment, its electrons had a particular peak that corresponded to a peak in the total photoelectron spectrum for thiophenone.
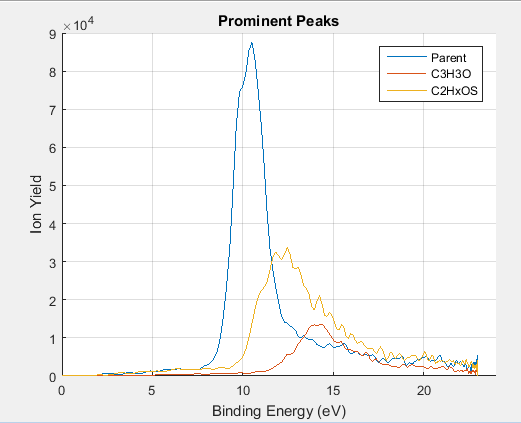
Figure 7: Photoelectron spectrum of thiophenone associated with several prominent fragments. Each peak has been normalized according to the ratio of its respective ion count to the total count of the three ions.
By summing the spectra from the most prominent fragments, we can construct the entire spectrum for thiophenone.
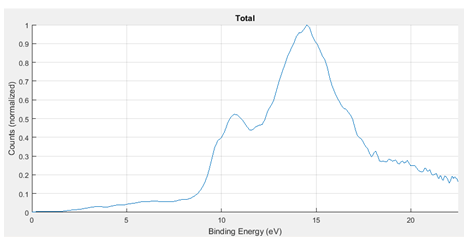
Figure 8: Photoelectron spectrum of thiophenone based on the sum of the spectra of the most prominent fragments.
Eventually, we hope to identify which molecular orbitals those electrons came from that caused the molecule to break up how it did so that we can understand the electron dynamics of thiophenone. This information can be helpful in future time-resolved experiments.
References
Acknowledgments
Thanks to Dr. Rolles and Dr. Rudenko for being my advisors this summer and to Shashank Pathak, the graduate student who helped guide me through this project. Thanks to the ALS for letting us come out to collect data and to the group of Professor Berrah from the University of Connecticut with whom we collaborated during the beam time. Finally, thanks to Kansas State and the NSF for making this REU possible!