Nanofiber-based Refrigeration Experiment
Alexandria Trevino
Southwestern University
Physics Major
Mentored by Dr. Bret Flanders
We studied thermoelectric refrigeration also known as thermoelectric cooling. This involves two electrical junctions one side is hot the other side is cold. The electrons on the hot side have a higher diffusivity than the electrons on the cold side. Therefore, they will diffuse onto the cold side leaving a positive charge on the hot side. Then, a potential difference is produced due to the charge separation similar to how a compositor works. This system can conduct an electric current and a transfer of thermal energy is occurring from the hot body to the cold body. We want to work with PEDOT because it can conduct an electric current and has a finite seebeck material. We grew the PEDOT wires using a technique known as DENA (Directional electrochemical nanowire assembly). This is where conducting polymers are electrochemically polymerized onto two electrodes immersed in a monomer solution. The monomer solutions that we made had 6ml of distilled water, 10mM of EDOT, and 100mM of Heparin. The second monomer solution had the same amount of distilled water and EDOT, but we changed the Heparin content to 10mM. To successfully productive these wires you must be working with three electrodes two counter electrodes and one working electrode. Once the wire is successfully grown we take the Current-Voltage profiles of each wire around ten data points. After gathering the data points, we will take our wire for AFM imaging (Atomic force microscopy). This is a microscope that measures the samples profile through the deviation of a laser beam. We use a tapping mode for AFM which is where the tip of the microscope oscillates up and down throughout the displacement of the wire. AFM imaging is good to use because it allows us to visualize the topography of the sample surface all the way down to the atomic resolution. Once the images are completed we take all the data points of the wire from an AFM software and convert it into a histogram. We then take the mean of the histogram to determine the diameter. From the ten current-voltage profiles I make voltage vs current graph and take the linear regression of each wire to determine the resistance. Finally, we calculate the electrical conductivity using the length of the wire, resistance, and cross-sectional area. Overall, from my results the electrical conductivity does not depend on the diameter, resistance, or length of the wire; therefore, you should see a consistency of the electrical conductivity values if the wire was grown at the same conditions.
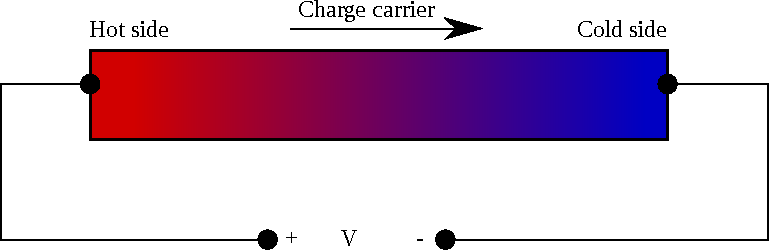
Figure 1. Thermoelectric Refrigeration Process
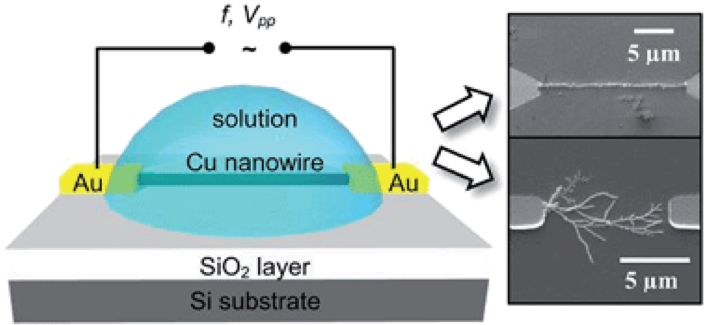
Figure 2. How DENA looks
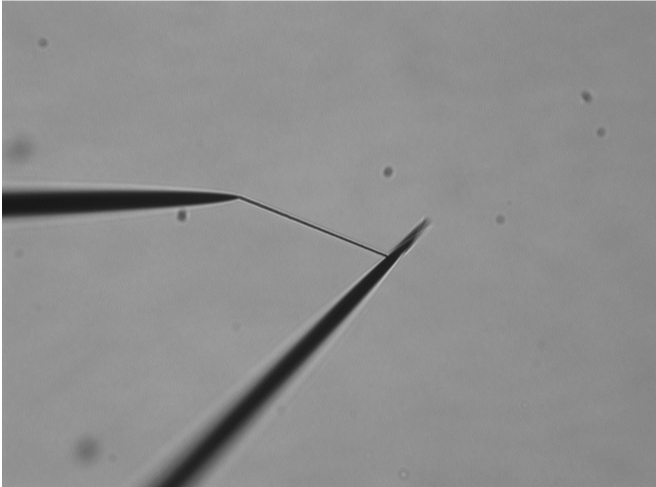
Figure 3. PEDOT wire connection for current-Voltage profiles
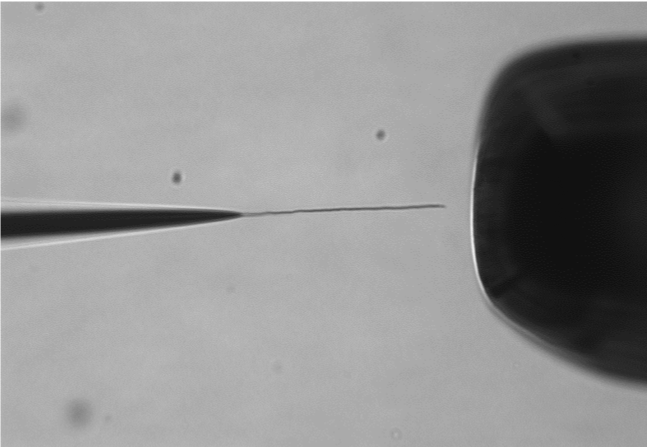
Figure 4. Wire growth from Counter electrode before connection
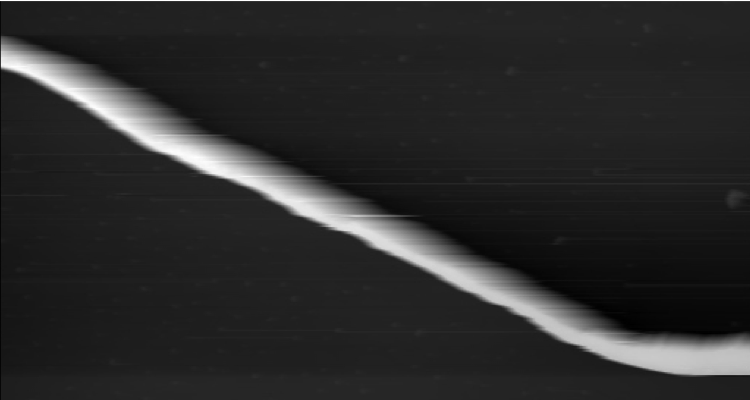
Figure 5. AFM imaging of a 963nm wire
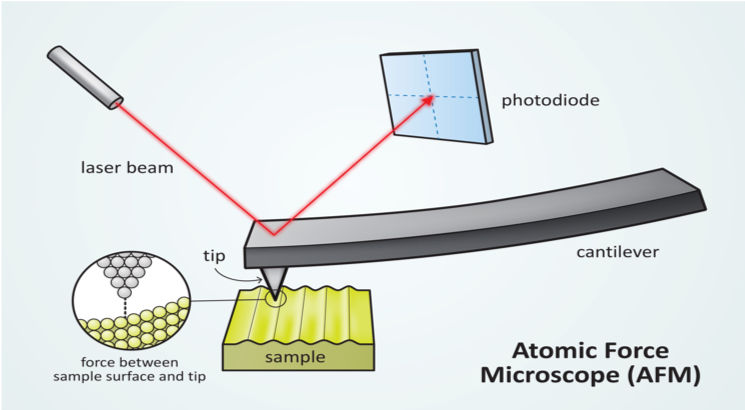
Figure 6. How AFM imaging works
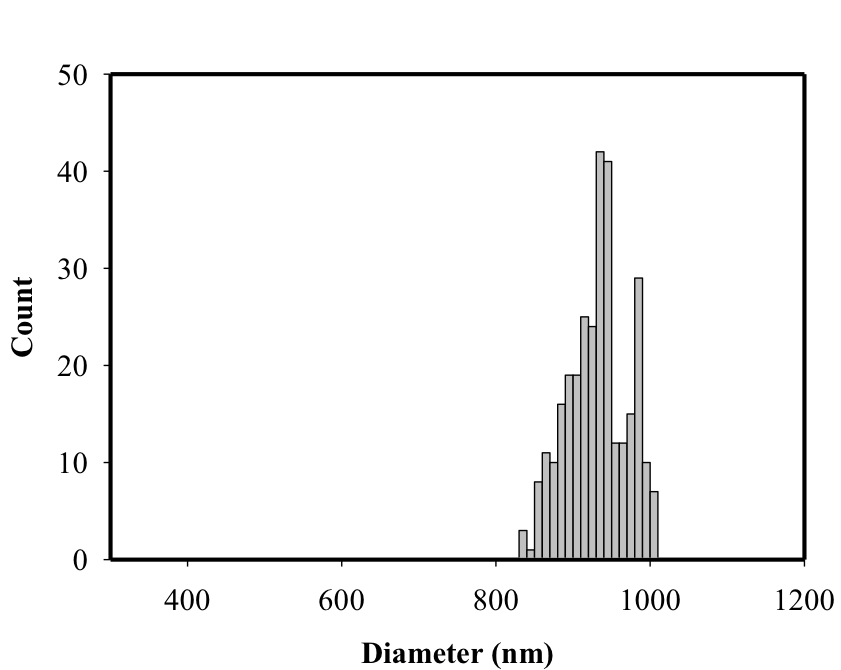
Figure 7. Took the mean of this histogram
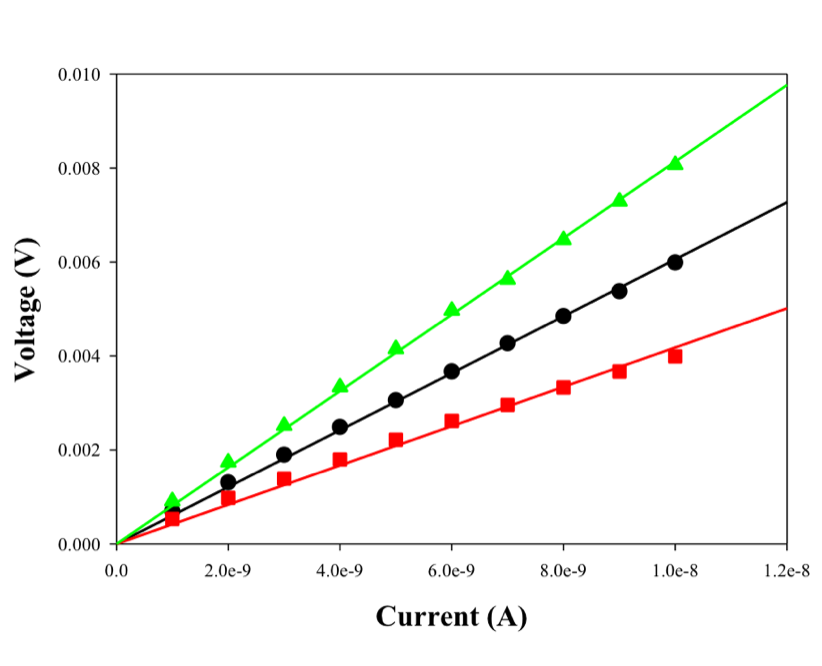
Figure 8. Voltage vs current graphs. the linear regressions of the lines results in the resistance
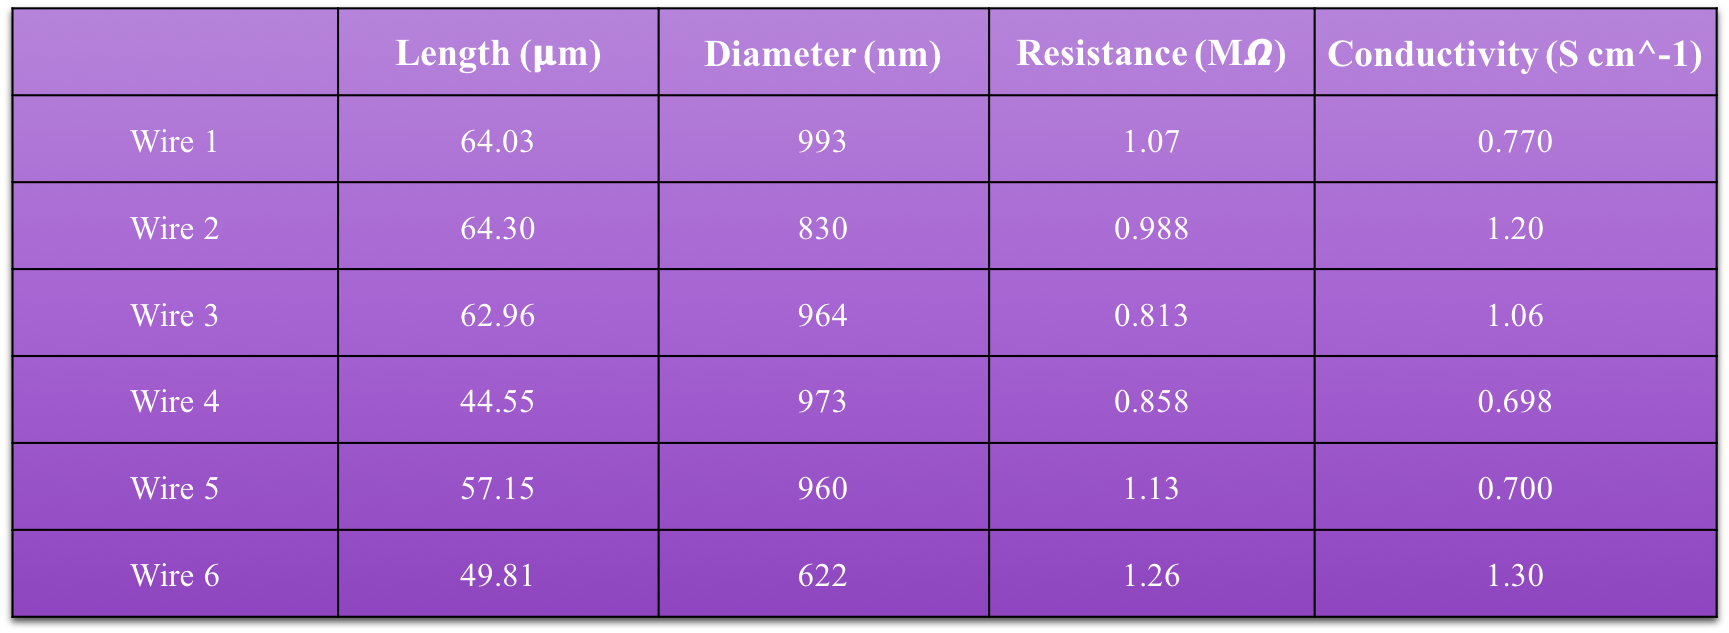
Figure 9. Data for 100 microM Heparin content
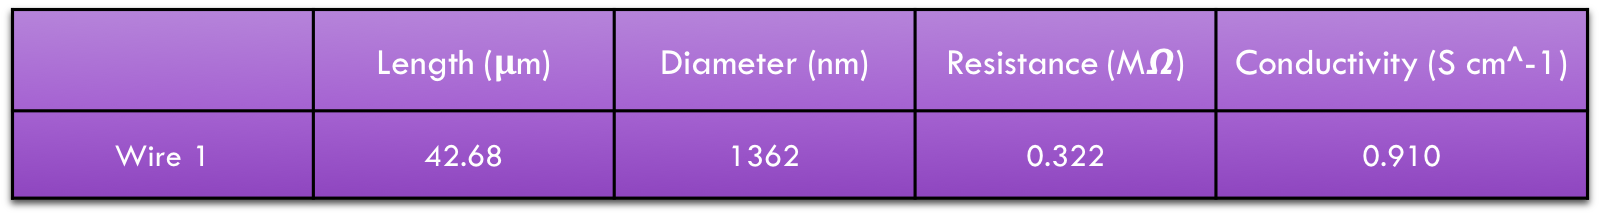
Figure 10. Data for 10 microM Heparin content
Acknowledgments
Bret Flanders, Krishna Panta, Gobind Basnet, NSF, and K-State.