Laser-Based Cathode-to-Anode Drift Velocity Measurement
Riley Roca
University of Illinois at Chicago
Engineering Physics Major
Mentored by Dr. Tim Bolton and Dr. Glenn-Horton Smith
MicroBooNE is a 170-ton liquid-argon time projection chamber (LArTPC) which is designed to do experiments that study neutrino interactions. It uses a series of criss-crossing wires that detect electrons that occur due to charged particles moving quickly and with high enough energy to ionize the Argon as shown in Figure 1.
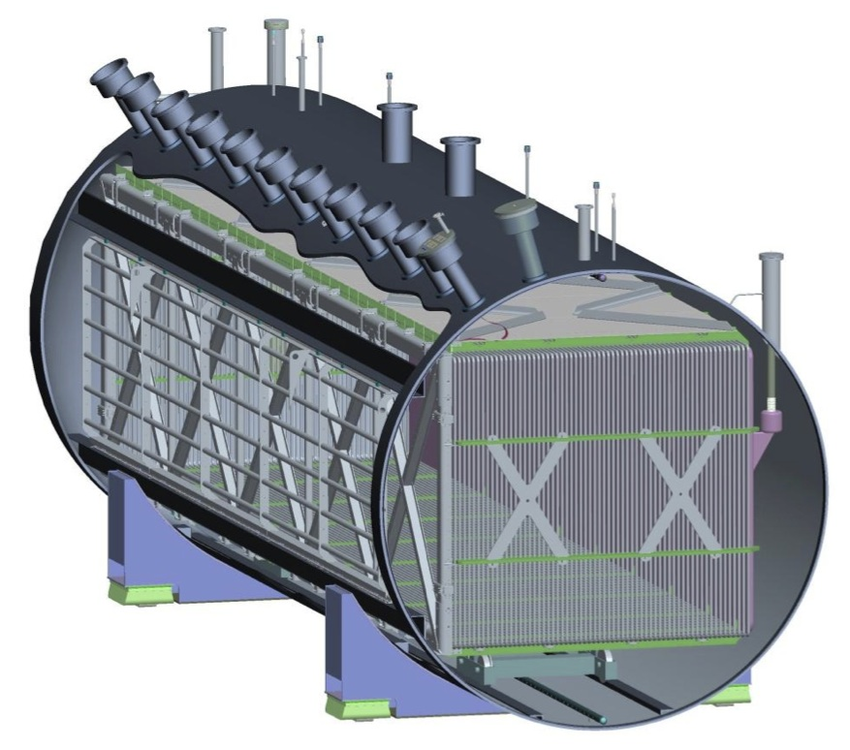
Figure 1: MicroBooNE schematic
An electric field is applied to the detector which causes the electrons to drift through the Argon. The events that we looked at were UV-laser data that was shot at the opposite side of the wires (the "cathode plane") because we see electrons coming off of the cathode plane due to the photoelectric effect as illustrated in Figure 2.
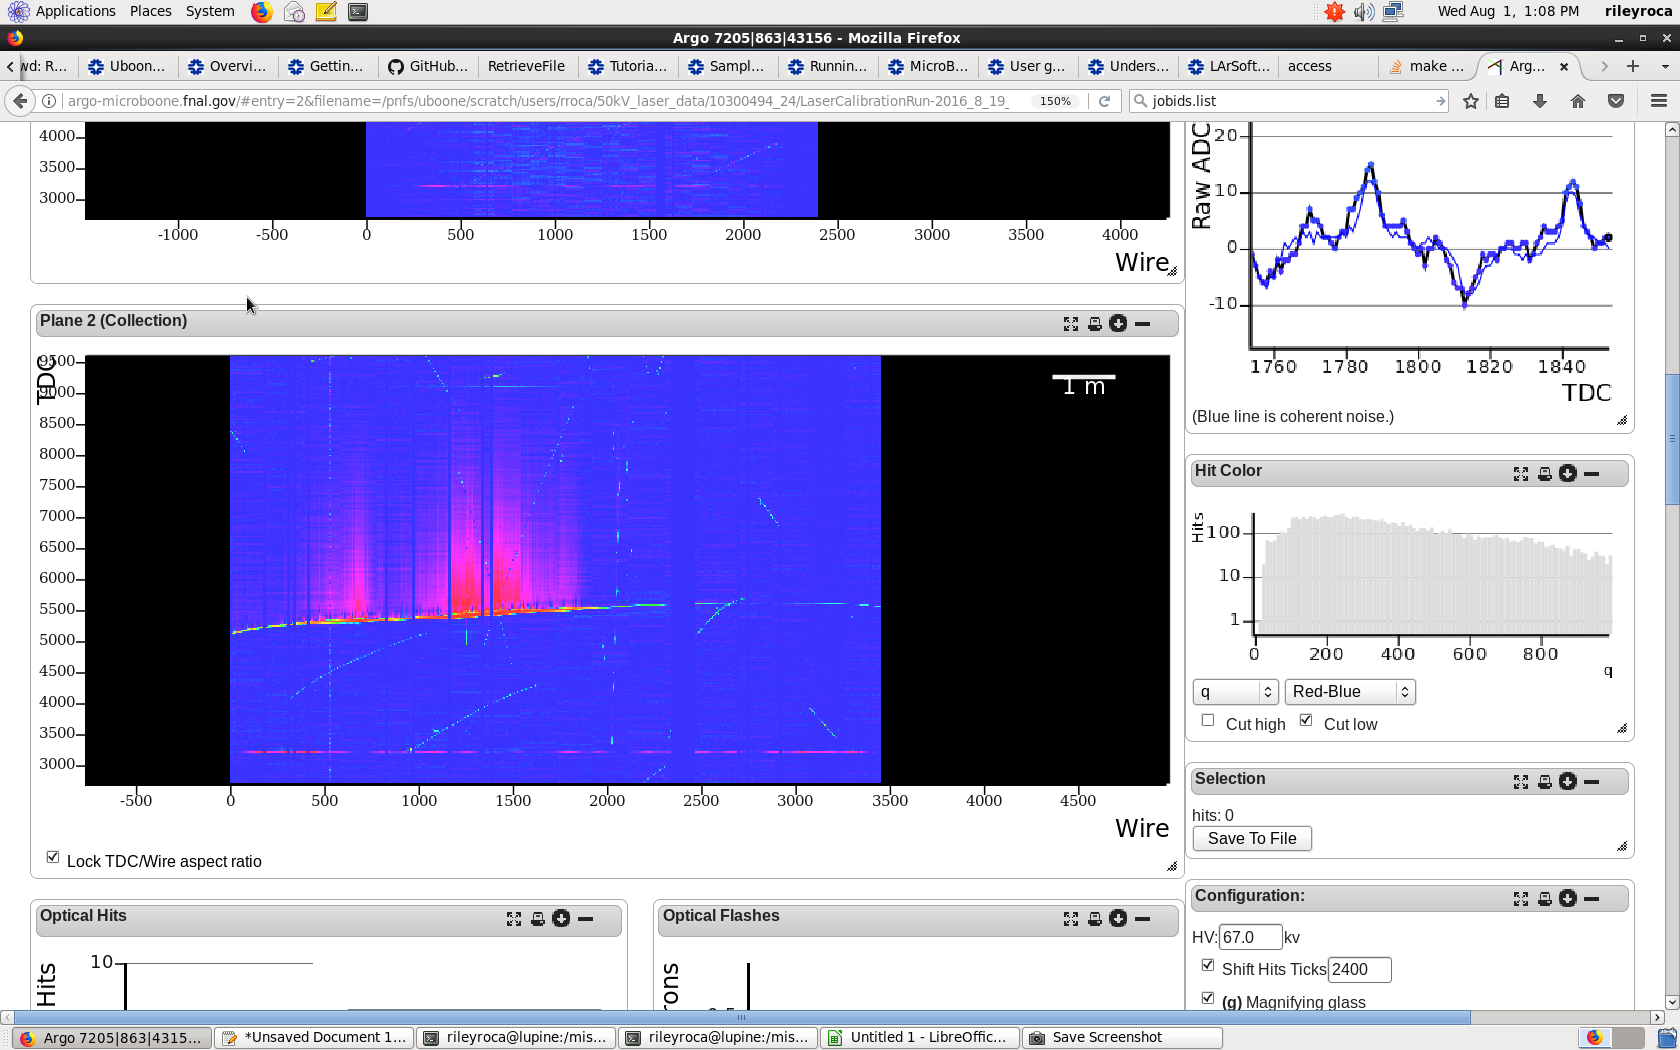
Figure 2: The lowest red line represents the time at which the laser is fired and the upper-most light blue line represents the electrons that come from the cathode.
We know the width of the detector and looking at Figure 3 we can can determine the time that it takes the electrons to travel the entire width. Knowing that one time tick is equal to 500 nanoseconds, we can then get the velocity at which the electrons drift through the Argon. After we average over a couple of runs at a field strength of .273 kV/cm we find that the drift velocity is 1.103 μm/ms. This lines up with what we expect from previous experiments looking at the drift velocity of Argon (4). Future directions could look at more data points with E-fields of strength between .195 ~.273 kV/cm. As we see in figure 4 there is a lack of data that has been taken around these field strengths. Also we could look at possible sources of systemic error including the measurement of the width of the detector not being completely accurate, the cathode may not be entirely flat, and also a space charge effect due to the positive Argon ions making the electric field not entirely uniform.
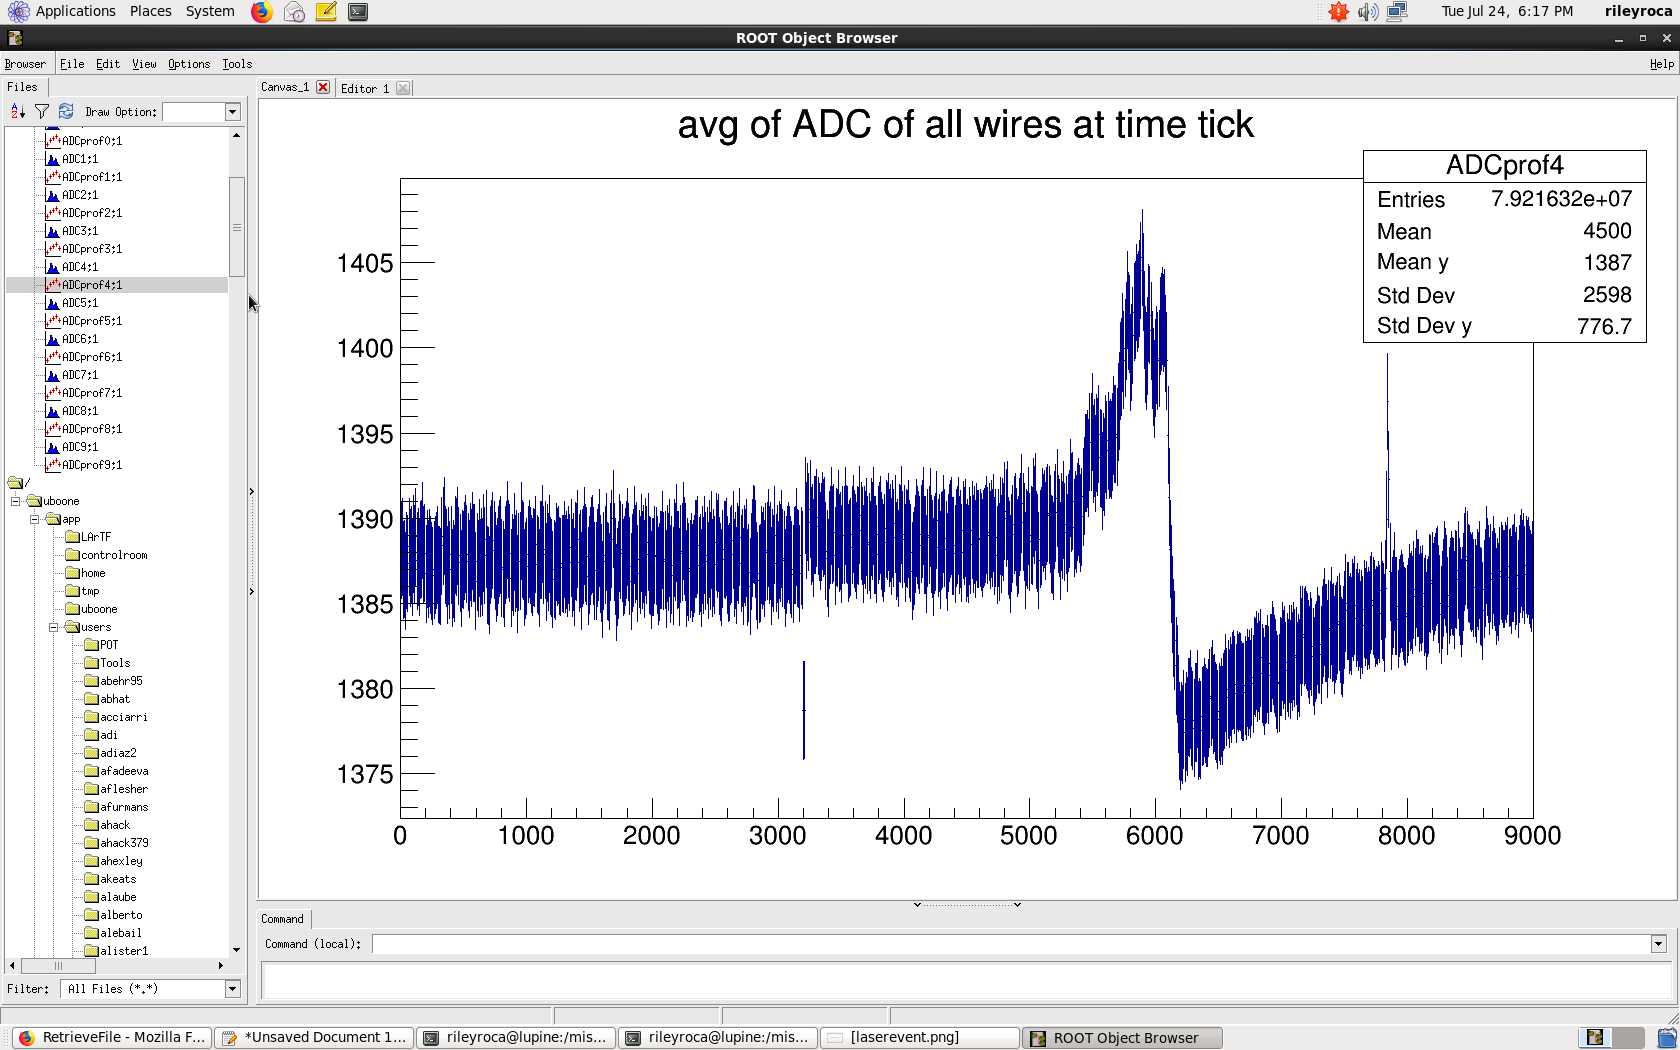
Figure 3: Another way to visualize the events that occurred. The low point at around 3200 is the laser firing and the peak at around 7900 are the electrons from the cathode plane. These values are averaged over the entire length of the detector (~3600 wires)
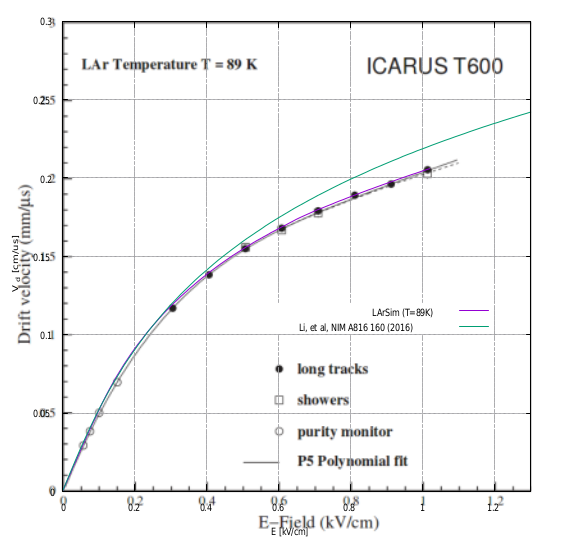
Figure 4: The purple line represents the drift velocity as a function of E-field that is used by MicroBooNE in its reconstruction software. The red dot is the measurement that we obtained and we see that it is consistent with what we expect.
Acknowledgments
Tim Bolton, Glenn Horton-Smith, Joseph Zennamo