Catalytic Activity in a Vesicle & Vesicle Production
Grant Hébert
Kansas State University
Physics Major
Mentored by Dr. Bret Flanders
There are two main parts to this project, understanding the catalytic activity & polymerization inside said vesicles and being able to produce them containing aqueous solutions of our choosing. To understand the catalysis and polymerization we need to be able to analyze the potentials and electric fields inside the vesicle, inside the lipid bilayer, and the outside of the vesicle (in the solution). Treating this as a three region EM problem you can solve for all of these unknowns, and graphing the result you attain the following graphs of the dynamic potential and electric field.
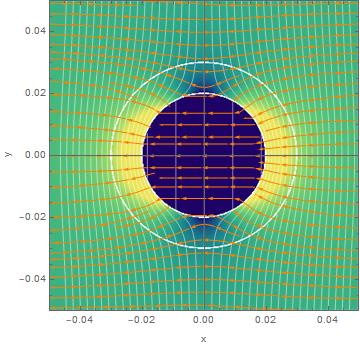
Figure 1: This top down view of a vesicle illustrates the potential in each region as a function of the radius and theta, note the axis are measured in microns
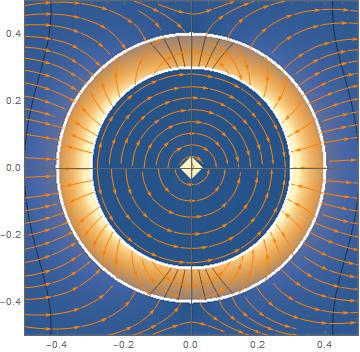
Figure 2: This top down view of a vesicle illustrates the electric field in each region as a function of the radius and theta, note the axis are measured in microns.
In order to analyze the electric fields experimentally we conducted dynamic light scattering (DLS) tests and photon correlation spectroscopy (PCS). Initially we did this in a 3% aqueous gelatin solution which was heated to 40° C and quenched down to 20° C. As the solution cools we conducted these DLS tests which sent the scattered light at a 90° angle into a photo-multiplier chamber and then into a detector which was connected to an autocorrelator. The data collected was then graphed and plotted as the second order correlation function (intensity correlation function, insert
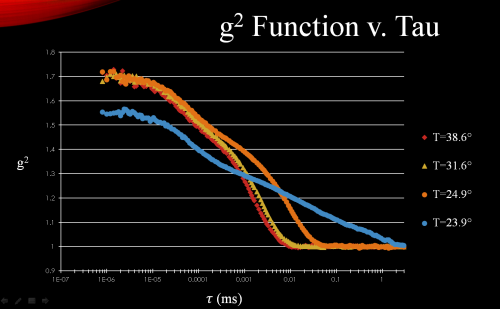
Figure 3: Second order correlation function (intensity)
Based off of work conducted by S.Z. Ren and Dr. Christoper Sorensen we used this data to calculate the first order correlation functions (electric field correlation function, which is what we are interested in,
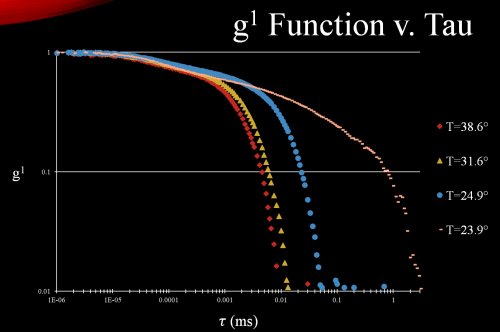
Figure 4: First order correlation function (electric field), note the significant increase in decay time as the solution cools is indicative that polymerization is indeed occurring. However in order to verify further calculations must be performed to definitively say.
This is important to understanding polymerization and catalytic activity in a vesicle because it allows us to perform radial calculations on the polymer chains and verify if the polymers are indeed growing as the solution cools and the first order correlation functions has statistical and coherent data on the electric fields inside the vesicle. The second part of this project is again, vesicle production (and ideally self-reproducing vesicles) with solutions of our own choosing inside. In this case we took a 3% gelatin solution and went through the process of producing vesicles. This was done initially because PCS analysis allowed us to determine whether or not the gelatin solution was inside the produced vesicles (i.e. did we see radial growth when quenched from 40° C down to 20° C). This confirmed that our desired solution was inside the vesicles. In order to potentially create self-reproducing vesicles we used DPPC & DLPE lipids at a ratio of 7:3 and cycled the temperature from 35° C to 42° C and back down again in accordance with Sakuma & Imai's findings in their 2011 paper, "Model System of Self-Reproducing Vesicles". However because the vesicles flow relatively freely in the solution a pressure system was introduced with a nano-pipette filled with the same solution our vesicles exist in. By applying a tiny amount of pressure on the pipette we were able to create suction near a vesicle and trap it to the pipette. This allowed us to cycle the temperature of the solution without disturbing the vesicle we are observing however we ran into issues with applying too much suction which, when heated, caused unexpected deformation of the lipid bilayer and may have affected the ability of the vesicle to reproduce effectively.
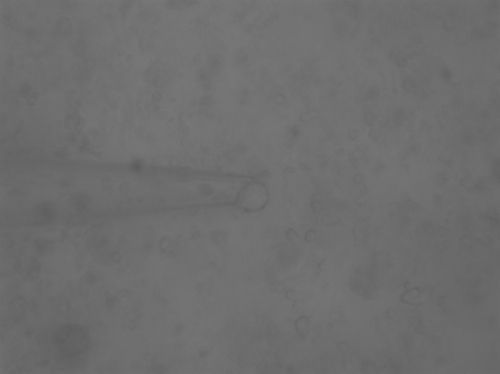
Figure 5: 29.7° C, Initial stage of the vesicle
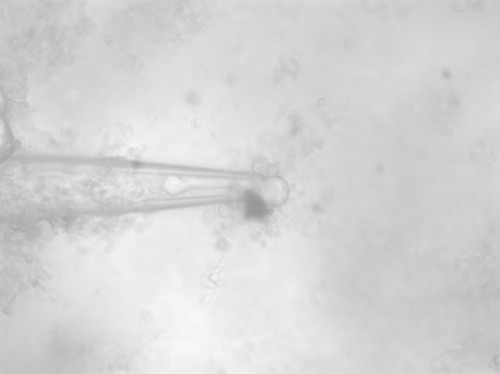
Figure 6: 35.5° C You can see part of the vesicle membrane deforming into the nano-pipette as heating occurs and potential budding at the upper part of the vesicle however because of the issues with suction nothing definitive can be said.
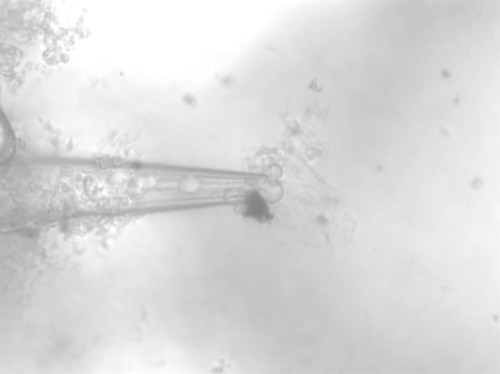
Figure 7: 37.1° C, images past this point we unable to be collected due to issues with the constantly changing contrast and general clutter in the solution; ergo still nothing definitive.
Further research directions for this project would include attempting to solve or limit the effect of many of the issues encountered in the imaging and temperature cycling process. Furthermore ideally we would like to be able to use the previously discussed DLS and PCS techniques in conjunction with imaging in order to analyze the environment inside the vesicle however the vesicle must again be held still for this process to be effective.
Acknowledgments
Dr. Bret Flanders, Dr. Chris Sorensen, Krishna Panta, Jordan Morris, Raiya Ebini