An Algorithm to Simulate Two-Dimensional Scattering Patterns for Use in Holography
Claudia Morello
Embry-Riddle Aeronautical University
Astrophysics Major
Mentored by Dr. Matt Berg and Dr. Osku Kempinnen
Holography, or the process of making holograms is not a new field, but it has not yet been sufficiently applied to small particles. Traditionally, a hologram is a photographic recording of a light field, produced from a laser and recorded onto a film. Then, the same laser is shown back through the developed film to recreate the particle. However, this is very impractical and time-consuming. Digitally creating the scattering pattern from the silhouette of the particle and the rules of light scattering and interference is much more efficient. This project focuses on creating an algorithm to produce two-dimensional scattering patterns using the Huygens-Fresnel Equation and the Babinet Principle, and applying them to small particles such as different types of pollen. Ultimately, this algorithm will be used in conjunction with a drone that will generate holograms of particulate matter in the air for use in agricultural research.
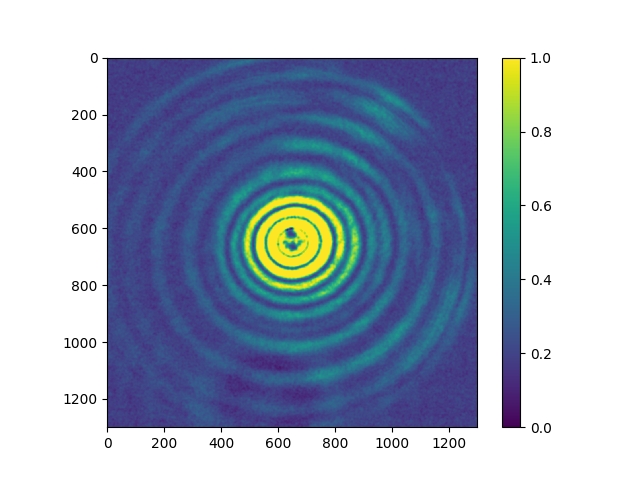
Fig. 1: The experimental scattering pattern of a glass sphere, recorded using a laser and a CCD camera in a laboratory setting.
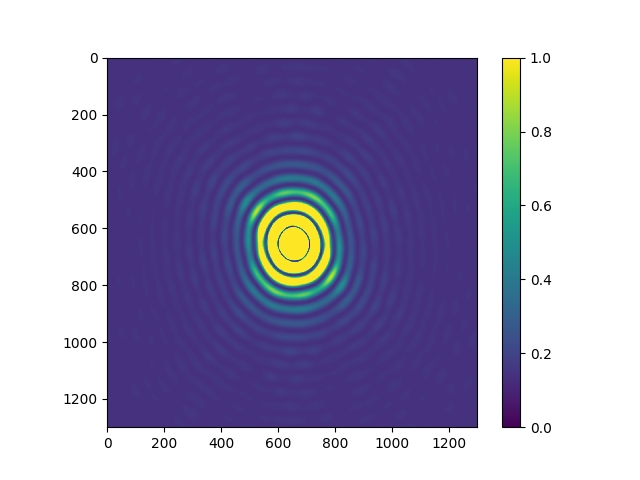
Fig. 2: The best simulated scattering pattern of the glass sphere, as produced from a Python code using the Huygens-Fresnel Principle.
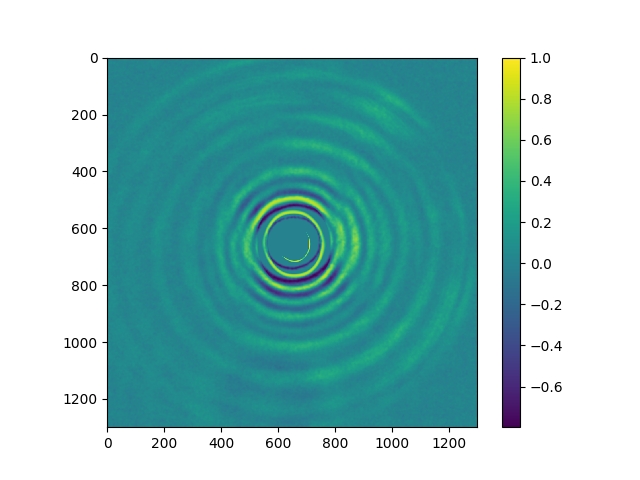
Fig. 3: The difference pattern of the glass sphere, produced by subtracting the simulated scattering pattern from the experimental scattering pattern. This shows how different the simulated scattering pattern is from the one created in the lab.
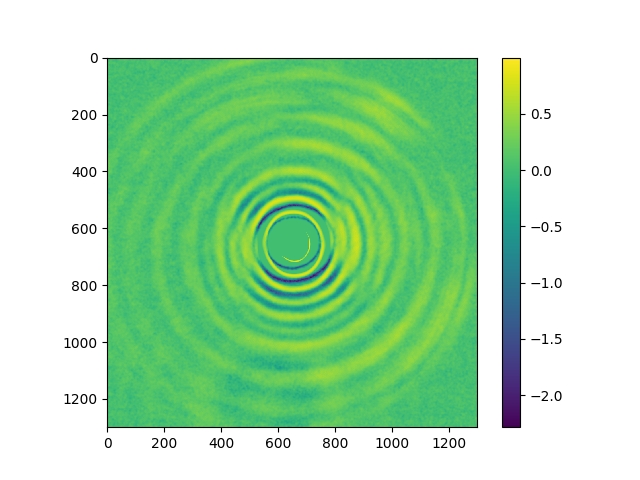
Fig. 4: The relative error plot for the glass sphere, produced by dividing the difference pattern by the experimental scattering pattern.
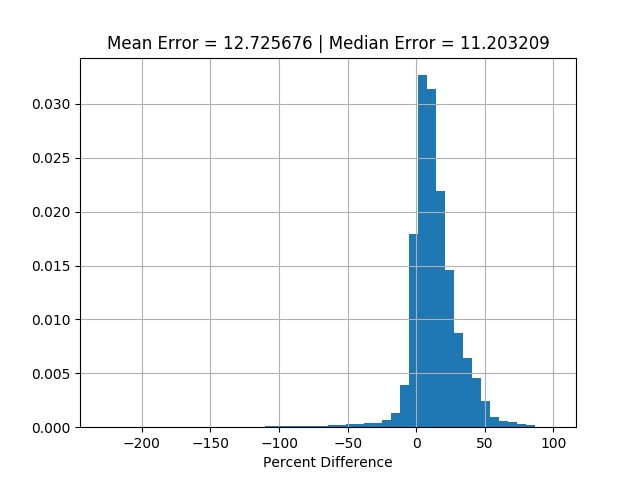
Fig. 5: A histogram of the percent difference between the glass sphere simulated pattern and the experimentally produced scattering pattern. The mean and median percent difference are displayed.
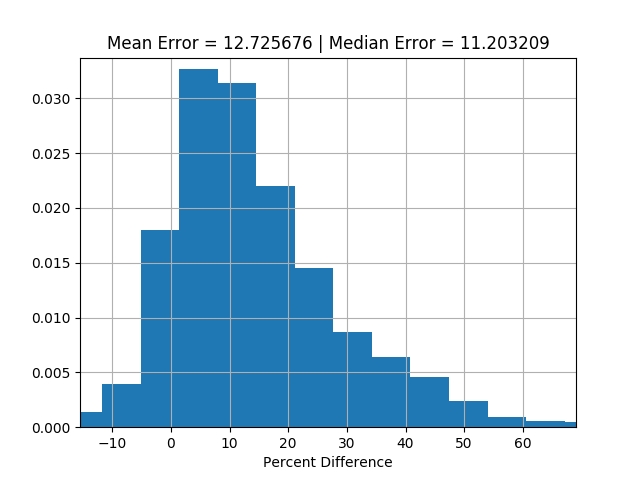
Fig. 6: A subplot of the percent difference graph to show more detail.
Acknowledgments
I would like to thank the National Science Foundation, U.S. Army Research Laboratory, Jesse Laning, and Ryan Mersman.