Constructing an Optical Parametric Amplifier (OPA) to allow for wavelength tuning over the visible range for PULSAR
Reid Erdwien
Kansas State University
Physics and Math Major
Mentored by Dr. Itzik Ben-Itzhak and GRA Travis Severt
The goal of the project is to build an OPA for tunable laser pulse wavelengths over the visible range. At its most basic level, an OPA is an arrangement of optical elements which, using nonlinear optics allows for a pump laser to amplify a range of wavelengths thus creating a laser source of tunable wavelength. For our particular OPA we wanted to amplify the visible wavelengths.
![LiH- Potentials from [1]. Arrows are my own.](/images/reu/2017/erdwien/1.JPG)
Fig. 1: LiH- Potentials from [1]. Arrows are my own.
Why do we want an OPA? Currently the wavelengths we can use for experiments in the lab are 790nm and 395nm. However, there are cases where interesting physics occurs between these two wavelengths. One such experiment is that of LiH- dissociation paths. Figure 1 shows the potentials of LiH- dissociation. [1] (Arrows are my own) We want to investigate the Li- + H potential. However, as can be seen from the colored arrows, 790nm (red) does not have enough energy to access it from the potential well. 395nm overshoots and causes the autoionization the molecule. A tunable OPA allows a wavelength corresponding with the green arrow, which would allow for experimental investigation.
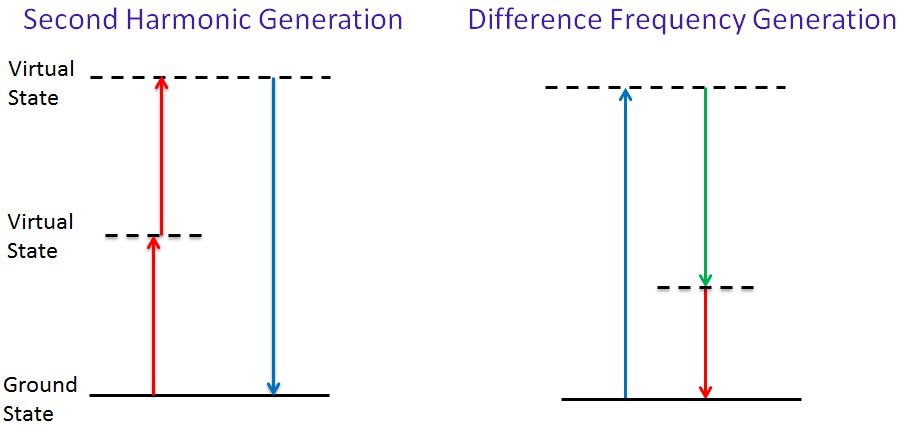
Fig. 2: Common nonlinear optical processes.
Before delving into the OPA process, here is a look at two other nonlinear processes. These processes arise when the intensity of the electric field is high enough that the polarization vector induced in the material is no longer directly proportional to the electric field. Additional terms dependent on E2, E3 and so on can become important. This can lead to unintuitive effects. On the left we see Second Harmonic Generation. In this process, two photons excite the material to a virtual state. The energy of both the photons is then emitted in the form of a single photon. This single photon, of course, has twice the energy of the input photons, twice the frequency, and half the wavelength. On the right hand side we see Difference Frequency Generation. In this process a single photon excites the material to a virtual state and then relaxes to the ground state via the emission of two photons.
![OPA Nonlinear process. From [2]](/images/reu/2017/erdwien/3.jpg)
Fig. 3: OPA Nonlinear process. From [2].
This figure shows the OPA process on the right, which is analogous to Difference Frequency Generation [2]. In this case however, the blue photon (called the pump) is accompanied by a green photon (called the signal). When the pump photon excites the material to a virtual state, the signal photon then performs a process akin to stimulated emission. This means that we end with two signal photons at the output along with an idler photon which has the energy difference between the pump and the signal. The left side shows a sort of "heat diagram" of what this process does to the incoming beams. In it, you can see that the pump's energy is depleted as the signal is amplified and the idler is created. Obviously there is not 100% conversion efficiency, so the pump beam is still present at the output, although it is diminished.
![Positive feedback loop. From [2]](/images/reu/2017/erdwien/4.jpg)
Fig. 4: Positive feedback loop. From [2].
Now we arrive at why the OPA process is an efficient amplification technique. It has to do with the signal and idler having a positive feedback loop. [2] That is, for both the signal and the idler, their intensities growth rate is proportional to their intensities. Or, expressed more succinctly, they exhibit exponential growth. As the beams travel through the crystal and the idler is created, the idler exhibits the same process of stimulated emission of the virtual state caused by the pump photon.
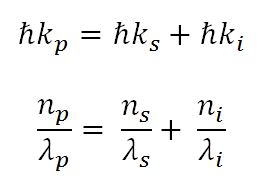
Fig. 5: Phase-matching equations.
Now, one of the requirements in order to observe efficient amplification is called phase-matching, which arises from conservation of momentum. The first equation is quite simple, and simply states that the momentum of the pump photon is equal to that of the signal and idler added together. (subscripts indicate pump, signal and idler photons) This equation simplifies to the second equation, where n is the index of refraction and lambda are the wavelengths. It is important to remember now that index of refraction is a function of wavelength, a fact often glossed over in introductory optics. If we satisfy this equation inside our material we will achieve phase matching and have efficient amplification with that particular signal wavelength. We can achieve phase matching for a specific wavelength through the use of a birefringent crystal and a specific cut angle. A birefringent crystal is one with differing indices of refraction of different axes, so you can imagine a particular cut angle meaning that the pump, signal and idler photon will experience the correct values in order to satisfy this equation.
![Non-collinear crossing. The left image is my own. The right is from [2]](/images/reu/2017/erdwien/6.JPG)
Fig. 6: Non-collinear crossing. The left image is my own. The right is from [2].
However, we want to have a tunable OPA, so we require a setup that is able to easily satisfy phase-matching for a large range of wavelengths over the visible spectrum. It is not easy to change the crystal cut angle every time you want to tune the OPA. We therefore cross the pump and the signal non-collinearly inside the OPA crystal. An angle alpha separates the two beams. As you can imagine, this complicates the phase-matching condition. On the right you see a figure that has signal wavelengths along the x-axis. [2] Note that these are in micrometers, so in fact this is over the visible spectrum. On the y-axis or see the phase-matching angle, or equivalently crystal cut angle needed in order to achieve phase-matching. This is for a particular crystal type (BBO) and for a pump of 400nm which is our pump wavelength. Curves of different cross angle alpha are drawn on. Note that the alpha = 0 case is the case of collinear propagation. For the collinear case you can see that phase matching can be satisfied over most of the visible range, but requires many different cut angles as the curve is bent. The bold line alpha = 3.6 is of interest to us. This line is fairly flat over the visible range, which means that phase-matching can be satisfied or nearly satisfied for a large range of wavelengths with the one cut angle of ~31 degrees.
![Tuning via time delay. From [2]](/images/reu/2017/erdwien/7.JPG)
Fig. 7: Tuning via time delay. From [2].
We can then achieve tunability over the visible range via the pump time delay. The signal beam is chirped, meaning different wavelengths arrive in the crystal at different times. The wavelength that time overlaps with the pump beam will then be amplified. The figure shows that the pump overlaps the green and therefore the green is amplified, however, if the pump beam arrived at the crystal slightly later, the yellow would be in the crystal and would then be amplified. So a time delay provides us with an easy tuning parameter.
![One-stage OPA schematic. From [3]](/images/reu/2017/erdwien/8.jpg)
Fig. 8: One-stage OPA schematic. From [3].
Now that we have covered the theory it is time to look towards building an OPA. Luckily for us, this is an established technology. People have built OPAs similar to ours in the past, and so we can look to them for inspiration and guidance. Here we have a schematic of a simple OPA. [3] In it, you can see that first the beam is split. A small fraction is focused sharply into a sapphire crystal. Through a nonlinear effect dependent on E3 this generates a White Light Continuum. The spectrum of the outgoing light is over most of the visible range. This will act as our signal beam. As you can see, the white light is then focused into a BBO crystal. The major share of the light is sent through another BBO, which is cut at an angle such that Second Harmonic Generation is efficient. This means that it has middle wavelength of around 400nm. This is our pump beam and is also focused into the BBO crystal. Depending on the time overlap different wavelengths will be amplified. So, we attempt to recreate this in our lab.
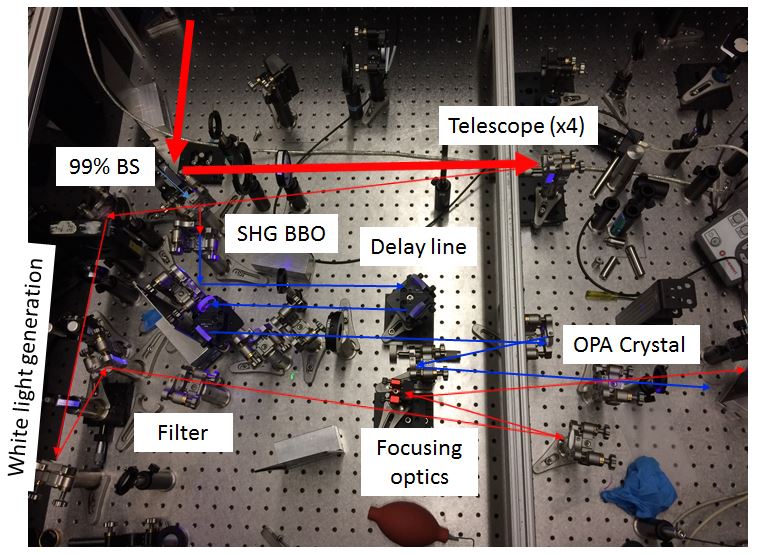
Fig. 9: A picture of our OPA setup.
Our setup is very similar. We first telescope the beam down to ¼ its original radius, then we beamsplit. A small fraction is focused into sapphire to create White Light and then focused into the OPA crystal. The major fraction goes through Second Harmonic Generation, goes through a delay line and is then focused into the crystal.
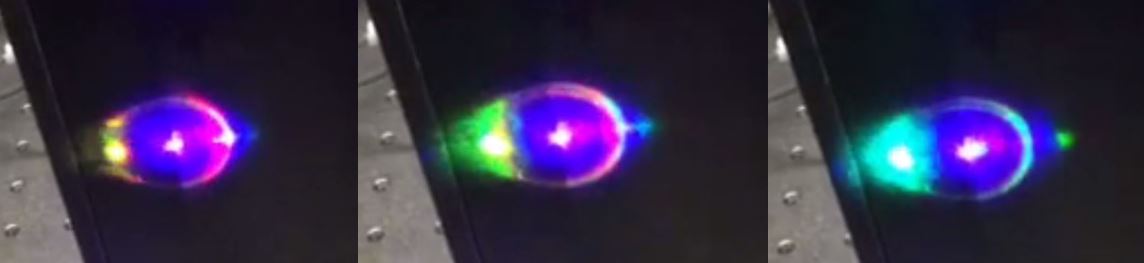
Fig. 10: A picture of the OPA output at 3 different delays.
These are some of the images we see out of our OPA as we have it set up. On the left you see the output signal beam. The middle beam is the pump. The ring results from noise and is called parametric superfluorescence. These images have the exact same alignment; the only thing changed is the delay line of the pump beam. As you can see qualitatively, we have different wavelengths or colors for different delays, just as predicted. We were able to match papers predictions about output power and spectrum. There was no reason to optimize further beyond this because we had a few known problems to tackle.
First and foremost our incoming beam from the laser was spatially chirped. This means that different wavelength arrive at different points on the beam spot. Spatial chirp is almost always undesirable, but is especially important to reduce for OPA usage as phase-matching and time overlap depends on the location within the beam. Second, we had a couple of problems with the OPA optics that I ordered. We were able to improvise to get the result images you see, but I neglected to order a proper mount for a piece of focusing equipment. This means the quality of our signal beam was diminished. The proper mount will be ordered for future development. There are some other changes that will happen in the layout as well.
For future development of this project we have to optimize the first stage of the OPA. We also need to construct a second stage. That is, another traversal of an OPA crystal by the signal of the first stage and additional pump beam. Additional stages help the output stability. Then the output pulse must be compressed in order to achieve higher intensities and better beam quality. Finally, we want the whole OPA setup to be as condensed as possible in terms of the space it requires to be set up. Then the lab will be able to perform many more experiments over a whole new range of ultrafast wavelengths.
References
[1] D.T. Chang et al., The Journal of Chemical Physics 117, 5757 (2002)
[2] C Manzoni and G Cerullo 2016 J. Opt. 18 103501
[3] D. Brida et al., J. Opt. 12(1), 013001 (2010).
Acknowledgments
Thank you for reading! My advisor was Itzik Ben-Itzhak and I worked closely on this project with Travis Severt. Additionally, I would like to thank Kevin Carnes, Bethany Jochim, Peyman Feizollah, and Shitong Zhao. Laser assistance was provided by Charles Fehrenbach and Raju Pandiri. Finally, thank you to the NSF and the entire K-State Physics REU program.
This work is supported by the Chemical Sciences, Geosciences and Biosciences Division, Office of Basic Energy Sciences, Office of Science, U.S. Department of Energy. REU was also partially supported by the NSF-REU under Grant No. PHY-1461251.