Electron Expulsion of Plasmonic Nanoparticles
Cooper Agar
University of Michigan
Physics Major
Mentored by Dr. Uwe Thumm
In recent years, ultrafast laser pulse techniques have enjoyed great technological advancements. As a result, one such technique, known as "pump-probe," can be used to view data with a time resolution on the order of femtoseconds (10-15 seconds) or even attoseconds (10-18 seconds) (see Fig. 1). This process involves "pumping" a sample (in our case, a nanoparticle) with an infrared laser pulse. This induces an electric field around the nanoparticle. We then "probe" with a much shorter wavelength, ultraviolet pulse. This second pulse causes an electron to leave the nanoparticle and propagate through the induced field toward a detector where we determine its final energy. By varying the amount of time between the two pulses, we can gather sufficient data to form a picture of how the system is behaving. In this work, we have created a computer simulation which samples thousands of trajectories per time step. This resulted in the spectral data of Fig. 2.
Previous work by this group has investigated how the size of the nanoparticle affected the spectra. At the time, only gold spheres were considered. In this work, we aim to investigate how the shape impacts these data, so we look at egg-like spheroids. We keep the volume of the particle fixed and change only its elongation. We find that greater elongation causes a greater amplitude in the center of energy (average) while also shifting this center of energy downwards (see Fig. 3) Additionally, we look at how the incident angle of the infrared pulse affects data. We find that as the incident angle increases, the amplitude decreases, however there is no shifting (see Fig. 4). Future investigations should consider how the following changes would affect data: altering the angle of the ultraviolet pulse, rotating either or both pulses, and further elongating the spheroids.
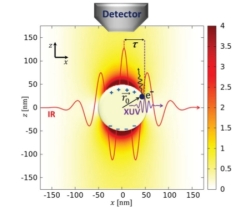
Fig. 1: System of pump-probe technique. An IR pulse pumps the nanoparticle while the XUV pulse probes it. The time delay, tau, is varied. Note that pulse wavelengths are not to scale.
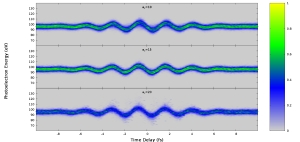
Fig. 2: Spectral data for three different shapes: spherical, slight elongation, and greater elongation. The colors refer to relatively higher or lower numbers of electrons with a given energy at the time delay.
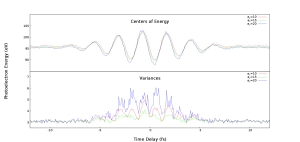
Fig. 3: Analysis of data from Fig. 2. Top: average energy for a given time delay. Bottom: variance from the average.
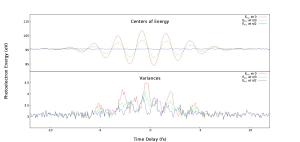
Fig. 4: As Fig. 3 except that these are for different incident angles of the IR pulse. Top: average energy for a given time delay. Bottom: variance from the average.
Acknowledgments
I would like to thank Erfan Saydanzad, Jason Li, Marcelo Ambrosio, and the National Science Foundation.