Department of Physics
Advancing physics through excellence in teaching and research so that people can understand the world around us, inside of us, and beyond us
Announcing the 2026 K-State Physics Newsletter
Discover our latest breakthroughs, faculty updates, and student achievements
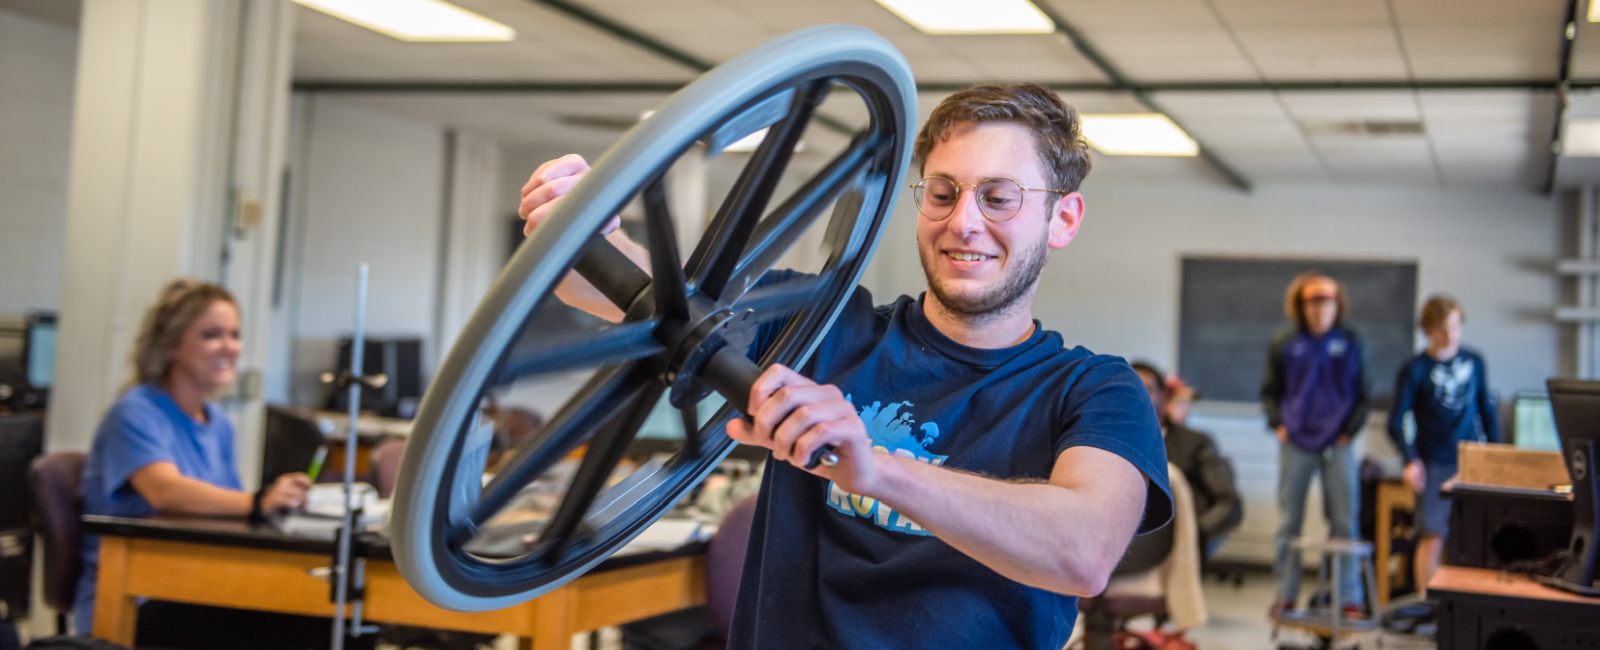
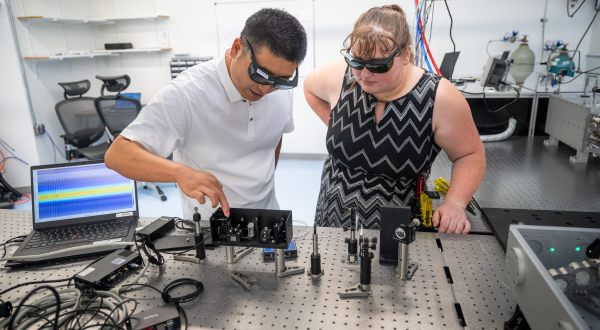
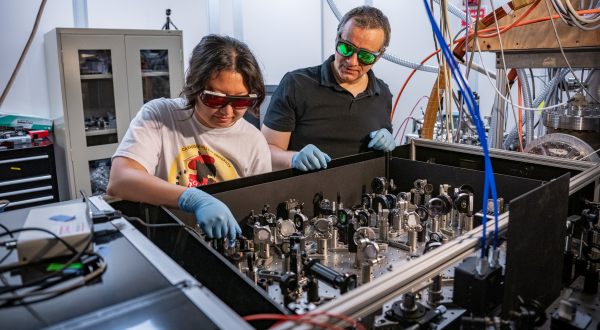
The Department of Physics at Kansas State University is built around highly productive faculty members with teaching and research expertise. Research is conducted in our department and other world-class facilities such as Fermi National Lab, CERN, DESY (German Electron Synchrotron), SLAC National Accelerator Laboratory, Lawrence Berkeley National Lab providing students a wide variety of experiences.
A full length (05:10) video is available on our K-State Physics YouTube channel.
Consider a major or minor in physics
Consider an advanced degree in physics
Recent News and Announcements
- Why Curiosity-Driven Research Matters for Our Future
- Research Brings Goldwater Scholar Vivian Nguyen, Physics Dual Major, Full Circle
- Artem Rudenko Named University Distinguished Professor
- Nobel-Prize Winning Physicist Eric Cornell Presented Chester Peterson, Jr. Public Lecture in Physics
- Bharat Ratra Named 2025 APS 5 Sigma Physicist Honoree
- Kansas State University Physicist Lado Samushia Promoted to Full Professor
- Graduate student Parker Poulos honored for excellence in teaching
- Physics Majors Viv Nguyen and Wynnstan Hessenius Earn College of Arts & Sciences Undergraduate Research Awards
Meet Our Accomplished Faculty
Our faculty conduct research in atomic, molecular and optical physics, in condensed, soft and biological matter physics, in cosmology and high-energy physics, and physics education.