
My Project
Jump to:
The Paper ^
The project I spent the majority of my summer on was essentially an attempt to model an experiment conducted in 2005 by Alexander M. Kalsin, Marcin Fialkowski, Maciej Paszewski and others. They had witnessed the self-assembly of charged, ligated gold and sliver nanoparticles, which can be thought of as looking something like this:
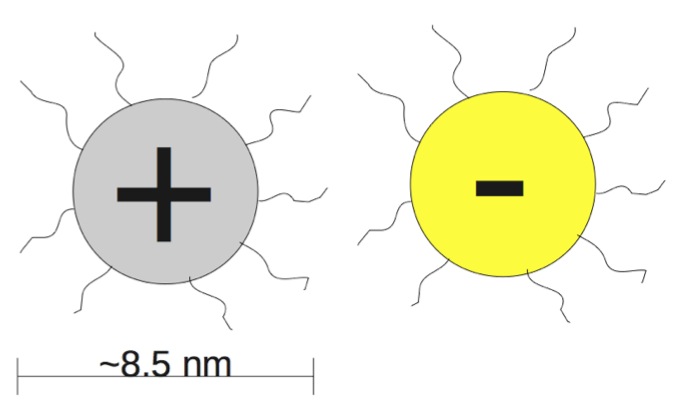
The gold and silver nanoparticles have roughly the same charge, but the charges are of opposite sign so that gold and silver are attracted to each other, but repelled by similar particles. The squiggly things represent the ligands. For the purposes of this model, we don't need to know much about them except that the charge is expected to be at their tips.
Kalsin et al. had observed that when these particles were mixed together, they would assemble themselves into a crystal lattice like the one seen in diamond, which looks like this (taken from the Naval Research Laboratory's website):
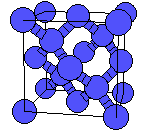
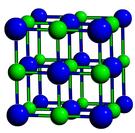
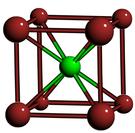
They measured the lattice constant - the length of a side of this cube - to be 18.5 nm. The other two lattice types that might have been expected are NaCl and CsCl:
The Model ^
In trying to model this experiment, we had to determine an equation for the interaction potential as a function of the separation between two particles. Interaction potential is an energy that tells us whether two particles are attracted to or repelled by one another, and by how much - if it is positive, there is repulsion; if it is negative, there is attraction. We assumed the potential had two main components: hard-sphere repulsion and a screened Coulomb interaction. The general form of the equation is:
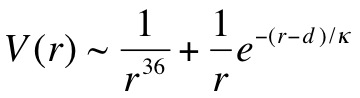
Here, r is the distance between the two particles, d is the diameter and Κ is the Debye screening length. The first term simply means that if the particles get very close there will be a very strong repulsion, because they are bumping into each other. The second term describes the charge interaction, with the 1 over r part being Coulombs law, and the exponential term accounting for the screening of this interaction that happens because the particles are in solution - Κ tells us how far apart the particles have to be before the charge interaction becomes much less important. Kalsin et al. calculated Κ to be 2.7 nm, so the particles have to be pretty close in order to "see" each other. The magnitude of the second term will also depend on the charges of the two particles, so that the term will be positive for like particles and negative for dissimilar particles. To give you an idea of what this equation means, here is a plot of interaction potential versus distance for dissimilar particles of various amounts of charge q:
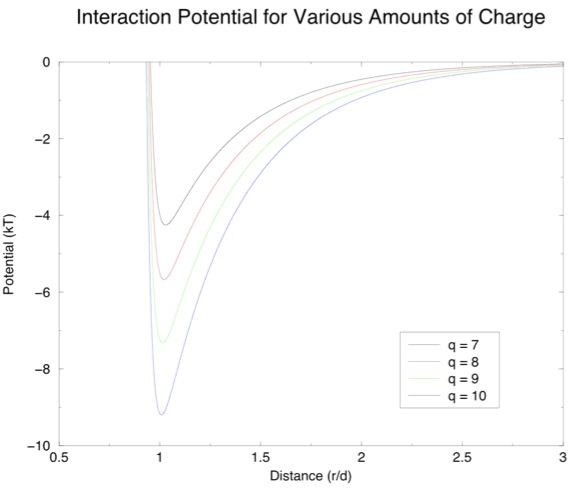
If this is a positive particle and a negative particle comes by, it might get caught in this "potential well" and so the two will stick to each other. Another positive particle might then come by and stick to the negative one, but since the first positive particle is still there, there will also be a repulsive force keeping the particles from packing together too tightly. This balance of attractive and repulsive forces will determine what kind of structure we eventually get, the hope being that a nice diamond-type lattice like the one seen in the experiment will form.
In order to test this equation, we ran what is known as a Brownian dynamics simulation. We created a bunch of virtual particles, threw them at random into a virtual box, and let them interact according to our equation. There are three results we might expect to see:
- No aggregation: the particles don't cluster together.
- Disordered aggregation: particles cluster together, but there is no apparent structure.
- Crystallization: particles cluster together in an ordered lattice of one of the three kinds mentioned earlier.
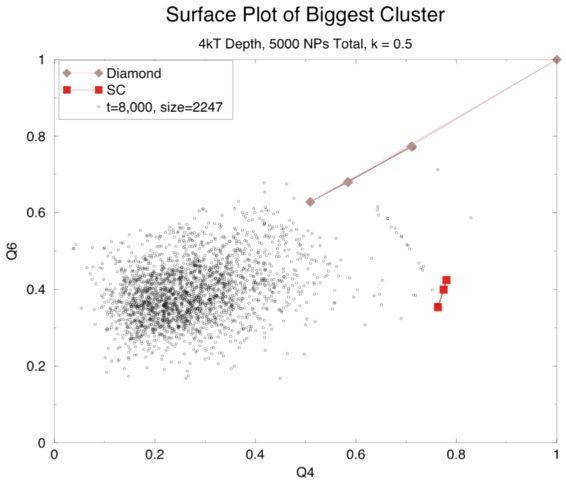
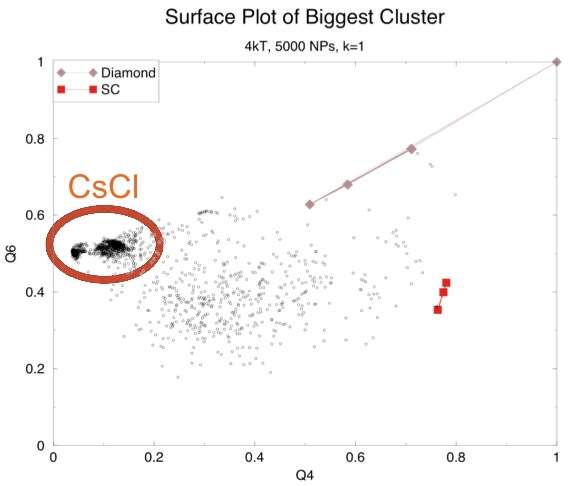
We can tell what kind of structure we have by calculating what are called "structure factors". If there is no structure the distribution for any given structure will be all over the place. Here is a surface plot of two such factors, Q4 and Q6, to show what this looks like:
And here is a NaCl lattice:
The Results - Part 1 ^
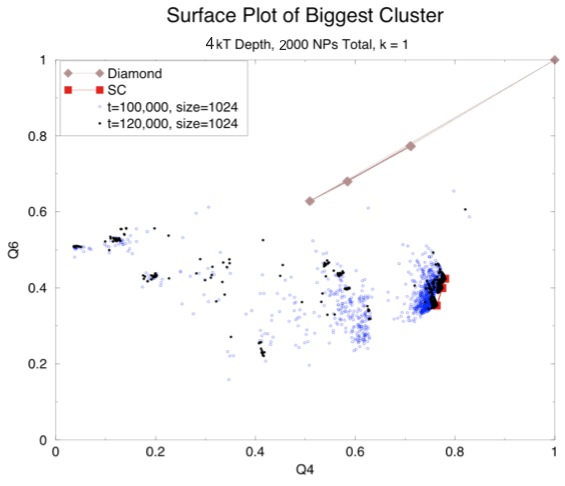
The last graph illustrates the odd result we got from our model: we ran a number of experiments with varying abouts of charge and varying concentrations of nanoparticles and, if we got aggregation it was almost always a NaCl lattice. Fortunately, concurrent to this, Dr. Chakrabarti had asked me to check the calculations in the paper which purported to show that a diamond lattice was the one you would expect for this setup. He suspected that this calculation, if done correctly, would show that a NaCl lattice was more favorable.
For each of the three lattice types, we know the number of nearest and next nearest neighbors and how far away they are for a given lattice constant. If we multiply the number of nearest neighbors by the energy at that distance, given by the interaction potential equation, and then add the energy for the next nearest neighbors, calculated in the same way, we get an energy that tells us how favorable the lattice is (contributions from neighbors further away than this are negligible, and are therefore not considered). We did this for each of the three lattices and found that the one with the lowest energy (and therefore the most favorable) is indeed the NaCl lattice.
However, if you look back at the equation for interaction potential, you will see that it also depends on the screening length Κ. I wondered if this calculation might tell a different story if the screening length was changed. To this end, I made a graph of screening length versus energy for each lattice:
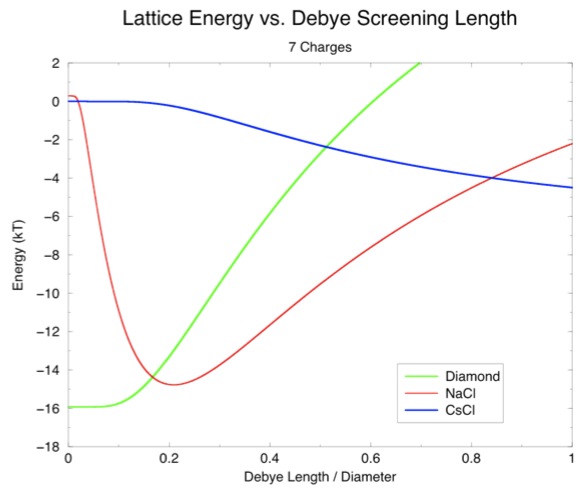
(Note that the lengths on the x-axis have been divided by the diameter to show the screening length as a fraction of particle size.) This graph suggests a window around 0.1, or about 1 nm, in which diamond will actually be favorable over diamond. Therefore, we ran some more simulations with different screening lengths.
The Results - Part 2 ^
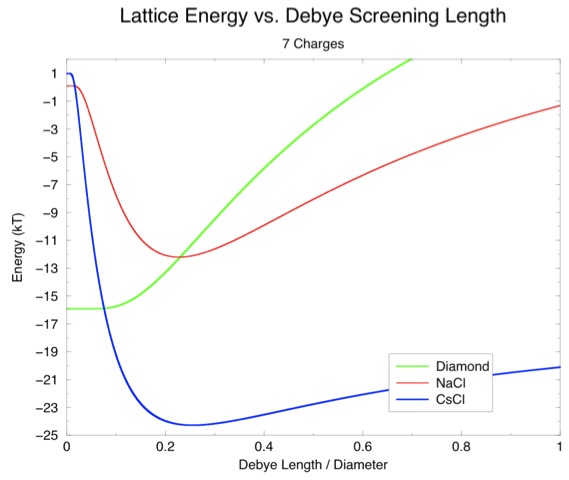
Surprisingly, even with these changes we mostly just saw more NaCl lattices and, even more surprisingly, in one simulation we saw a CsCl lattice:
This seemed odd since our calculation had shown that CsCl was the least favorable. However, that calculation assumed a lattice constant of 18.5 nm. The particles in out CsCl cluster were much closer than that. Another graph of screening length versus energy with the neighbor distances observed for NaCl and CsCl in our simulation shows the difference:
Questions ^
So now we have two problems: first, why are we still getting NaCl even with a screening length of 1 nm (or 0.1 on this graph)? Second, why aren't we getting CsCl except in one case? It is worth noting that a second look at the earlier surface plot that shows primarily a NaCl lattice (the one with the black and blue dots) seems to have a little CsCl structure, which is not uncommon. Perhaps CsCl really is the structure with the least overall energy, but there is some energetic barrier that normally prevents the particles from getting as close as they are in that lattice.
These are all interesting questions but, unfortunately, my research internship is almost over and there isn't enough time to answer them - at least not while I'm at KSU.