Activities
Week Three:
Finishing the Training Program
(6/11-6/15)
|
|
Activities Week Three: Finishing the Training Program (6/11-6/15)
|
| Weekly Reports: |
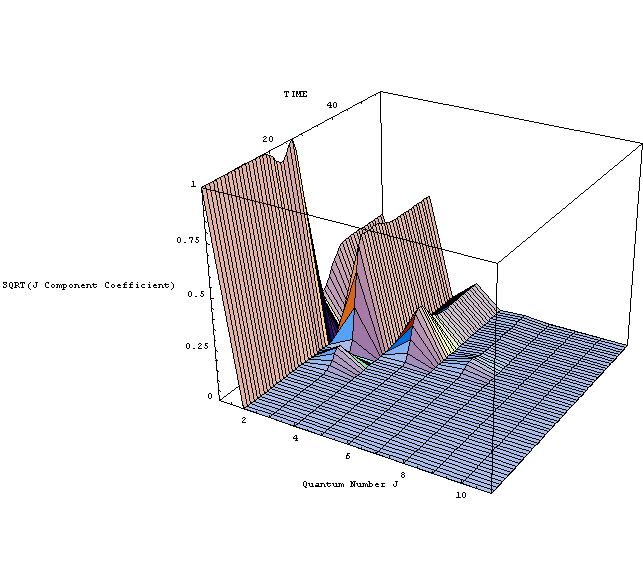
By the end of this week I had become very familiar with the input output capabilities of Mathematica 5.2 and Fortran 95, specifically because I was using Mathematica to do my integration for me. I could have evaluated the integrals numerically in Fortran, but I trusted the exact nature of Mathematica more so. I had to try on different GNU licensed library routines to get the version of the program below to work. All in all I was pleased with the resulting figures I was able to create. I basically used the same data files to create graphs in Mathematica, GNUPlot and a program called XMGR. I was able to create figures like the one below:
|
This picture represents the composition of the particular wave function I was dealing with in the program. Mathematica turned the data file into a surface plot. Though this type of information is not best represented this way, I like the way the plot looks.
The data is not best represented this way because the information along the quantum number axis seems to give people who see it for the first time the impression that there is some lack of information. However, there obviously is not, hence the term quantum number. |
||
|
Ethics: |
||||
| Relevant Links: | ||||
|
Favorite Media: |
||||
