A picture of the output of my
program can be seen below. The basic set-up of the spectrometer consists of a
beam of light hitting a focusing mirror. After reflecting off the mirror, the
beam hits a diffraction grating, where the light is diffracted different angles
depending on the wavelength. The diffracted light hits a microchannel plate,
which is a plate that basically emits electrons when a photon hits it. The
electrons from the microchannel plate hit a phosphor plate that is positioned
behind it. When the electrons hit the phosphor plate, the phosphor plate
fluoresces, which creates a mark on the plate in the visible portion of the
electromagnetic spectrum.
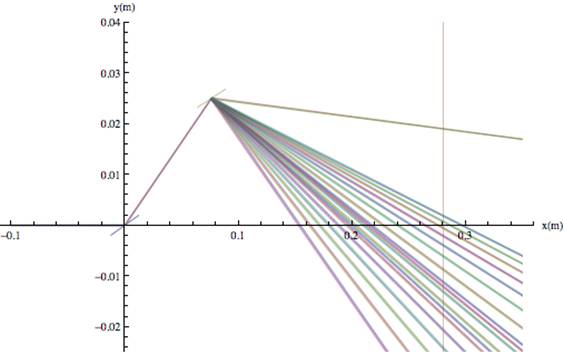
A model of the experimental set-up. A beam of light
hits a focusing mirror, hits a diffraction grating and the light diffracts
based upon its wavelengths. Only the zero, first, and second order diffraction
are shown in this picture.
In the program, all positions
and angles are variables. Thus, all these variables are changed in order to
find the effect each component has on the width, positions and separation of
the spectral lines that are shown on the phosphor plate.
In order to make sure my
focusing mirror was working correctly I generated this picture.
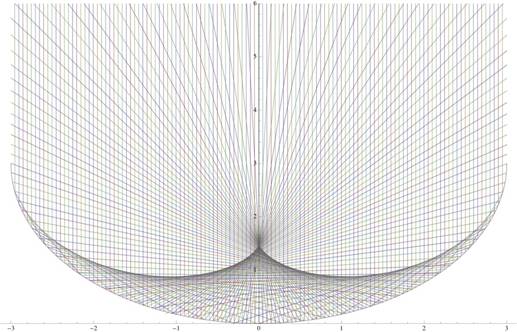
This is a picture of parallel
beams of light hitting a spherical mirror with a radius of convergence of 3
meters. According to this picture, the light focuses at the point 1.5 m, which
agrees with theory. Thus, I was convinced the mirror I modelled was working
correctly.
From this model, the
positions and the widths of each harmonic can be determined on the MCP. An
example plot of the intensity of each harmonic on the MCP can be seen below.
The position is given in meters, the intensity is given in arbitrary units.
From this data, and
calculating the respective horizontal widths of each spectral line, a picture
that shows the theoretical positions and widths of each spectral peak can be
generated. The picture shown below is a theoretical representation of data that
should be generated on the phosphor plate in the lab. This picture was made
using Mathematica.
A theoretical spectrum of the 11th – 29th harmonic as it would be seen on the phosphor plate.
An example of a spectrum generated during an experiment can be seen below. The white mark in the center of this photo is a burn mark on the camera. Note: the phosphor plate used is burned in the center, so the spectral lines will be a lot less intense in the center due to the decreased efficiency of the phosphor plate.