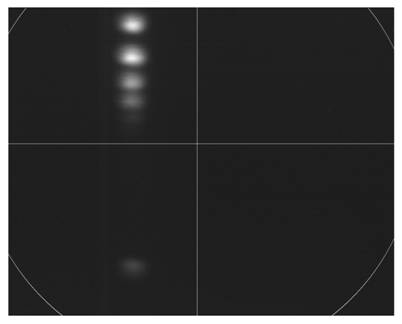
Shown below is a picture of
the spectrum obtained by the spectrometer that was initially installed. In
order to obtain this picture, photons were diffracted different angles
depending on their wavelengths from the diffraction grating. The photons then
hit a microchannel plate (MCP), which releases elctrons where the photon hit
the MCP. Behind the MCP is a phosphor plate, the phosphor plate fluoresces when
electrons hit it. This picture is an image of the phosphor plate. Note that the
spectral lines are extremely blurry. Also, the size of the spectral lines are
approximately 800 microns in size, which is significantly larger than
predicted. With the current positioning of the camera, only a portion of the
phosphor plate is visible. An outline of the phosphor plate is shown in white.
Since only a portion of the phosphor plate was visible, we decided to modify the apparatus in order to see the entire phosphor plate. When we opened up the chamber in order to modify the picture, the reason for the poor resolution was discovered. The separation between the MCP and the phosphor plate was approximately 1 cm. The distance between the two should be on the order of 3 mm. If the distance between the MCP and the phosphor plate increases, then the area of each mark on the MCP will be magnified on the phosphor plate, but with a decreased intensity. If this distance is shortened, then each spectral line will be sharper with a higher intensity. A picture of the new spectrum can be seen below.
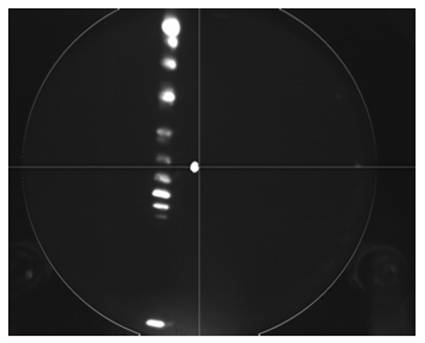
Note the entire phosphor plate is visible in this image, as evident by the outline of a circle seen in the photo. Also the spectral lines are significantly sharper. The white mark on the center of the picture is a burn mark on the camera. When the beam was directed on the MCP plate directly without hitting the diffraction grating, the intensity of the phosphor plate was so bright that it burned the pixels in the center of the camera.
We also discovered that the phosphor plate that is being used is burned in center, which results in an efficiency loss. This is clearly seen in the picture of the new spectrum. The spectral lines near the center are less intense than the other spectral lines. Looking at the picture of the old spectrum, there are no spectral lines near the center of the phosphor plate. Since the intensity of the old spectrum is less, no spectral lines appear near the center due to the decreased efficiency.
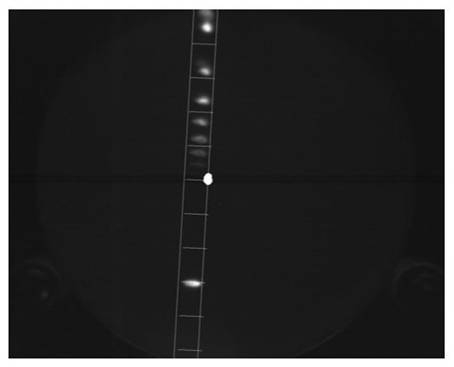
In order to obtain a spectrum from these images, the pixel values are integrated along the horizontal lines shown in the image below. The two vertical lines in the image show the area of integration.
The wavelength based upon the position on the phosphor plate can be obtained using the equation
mλ =d (sin θi – sin θd)
where d is the slit spacing, m is the diffraction order, and the two angles are the incident and diffracted angles respectively. With the wavelengths, the photon energies can be calculated using the equation
E = hc/λ
where h is Planck’s constant and c is the speed of light. The energy spectrum obtained from the above picture can be seen below.
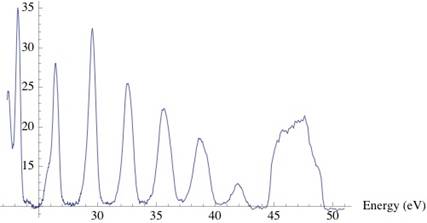
Note that the peak after 44 eV is due to the burn mark on the camera, this is not a peak due to an incident photon.