Class 13.5 (0xD.8): Feldman-Cousins confidence regions
How do we choose confidence intervals (Neyman construction)
(Following section 32.3.2.1 in [PDG-Stat].)
Find intervals for each value of the parameter
 such that
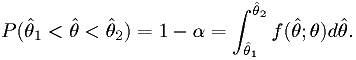
Here
 is the p.d.f. of the estimator
  .
. and
and  should depend on monotonically.
The functions are invertible:
should depend on monotonically.
The functions are invertible:  implies
  .
.Then (see figure)

The "Feldman-Cousins" method for generating "unified" confidence intervals
(See section 32.3.2.2 in [PDG-Stat].)
- We pick the edges of the region to have a particular difference
log-likelihood from the best fit point,
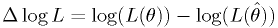 .
. - The right
 to use varies as a function of the best
fit parameters. So you need a "map" of the correct
to use when checking whether each value of should be in or
out of the region.
to use varies as a function of the best
fit parameters. So you need a "map" of the correct
to use when checking whether each value of should be in or
out of the region. - If the parameter space has a boundary, it's no problem, the "map" adjusts the log-likelihood level to encompass enough space.
- Note that the "difference in log-likelihood" is simply the log of
the Neyman-Pearson test statistic hypothesis test. The
"Feldman-Cousins" technique is equivalent to doing a two-hypothesis
test for each possible value of , rejecting points where the
hypothesis "the true value is " would be rejected at the
 significance level.
 - In general, the p.d.f. of the log-likelihood is generated via MC for each setting of each parameter, just like the hypothesis test.
The Feldman-Cousins procedure in detail
The procedure for building up the "map" of cutoffs is
simply to build the p.d.f.s for on a grid of values of
the parameters. For each point on the map, find the value
 below which a fraction
  of the
distribution lies.
of the
distribution lies.
cutoffs for all theta:: for this parameter (see below) for this parameter in the arrayThe procedure for building up a p.d.f. is essentially
identical to that for building up the p.d.f.s of the  for a significance test, except for the quantity evaluated. (Contrast
the steps below to Class 0x0B example 4.)
for a significance test, except for the quantity evaluated. (Contrast
the steps below to Class 0x0B example 4.)
: at the best fit point
 at the true value
Drawing the confidence region
This is simplicity itself:
of the best fit point and your map from above, for your real data at that parameter to find 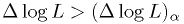 at this point in the map?
Exercise/assignment
Build the 90%-CL and 99%-CL confidence regions for the same
exponential + background of the assignment from class 11 (aka class
0x0B), with the restriction that the background parameter  must be
in the range
must be
in the range  and the mean
  must be positive.
- Note this is a good example of where the full Feldman-Cousin's treatment is usually necessary: non-Gaussian model, limits on parameters.
- Just follow the Feldman-Cousins procedure.
- Initially, use a grid of 10 divisions from 0 to 1 for , 10 divisions
over the range
 for .
for . - Print out the map of
 to make sure it is reasonable.
(Should be
to make sure it is reasonable.
(Should be  for the 90% CL.)
 - Print out or draw the confidence region.
- After getting this to work, make the grid finer if you like.
| [KamLAND2008] | KamLAND Collaboration, "Precision Measurement of Neutrino Oscillation Parameters with KamLAND", Phys.Rev.Lett.100:221803,2008; arXiv:0801.4589v3 [hep-ex]. |
| [DZero2010] | D0 Collaboration, "Evidence for an anomalous like-sign dimuon charge asymmetry", Submitted to Phys. Rev. D, 2010; Fermilab-Pub-10/114-E; arXiv:1005.2757v1 [hep-ex]. |
| [PDG-Stat] | "Statistics", G. Cowan, in Review of Particle Physics, C. Amsler et al., PL B667, 1 (2008) and 2009 partial update for the 2010 edition ( http://pdg.lbl.gov/2009/reviews/rpp2009-rev-statistics.pdf ). |