2/21/06 clc
Visible
Light Spectra and Interferometers
Excited atoms and molecules emit line spectra, with each spectral line corresponding to a transition between well defined upper and lower energy levels. The higher the resolution of the instrument used to observe the spectral lines, the deeper one can see into the structure of these levels. In this experiment you will proceed from the simplest spectra to probe ever more detailed structure. For hydrogen, a true one electron atom, you can resolve only the principle quantum numbers n, although you will be able to observe that hydrogen and deuterium have slightly different spectra. For sodium, a quasi-one electron atom, you can resolve both l and n, and eventually also the fine structure splitting caused by the interaction of the electron spin with the magnetic field seen by the electron as it orbits through the electric field of the nucleus. For mercury, a two-electron atom, the fine structure is relatively large and can be easily observed. You will be able to see hyperfine structure caused by the interaction of the magnetic moments of the electronic and nuclear systems.
In order to probe spectra in increasingly higher level of detail, you will need instruments of increasingly better resolution. In this experiment (part A) the StellarNet spectrometer has the poorest resolution, but is good for quick surveys. A MacPherson monochromator working on the same principle, but much larger, gives much better resolution (around 0.01nm) and allows you to see fine structure in sodium and the isotope effect in hydrogen/deuterium.
To go further requires either a huge spectrometer not available at KSU or an entirely different principle. In this experiment(part B) we go to interferometers, which are capable of zooming in on a single spectral line and examining it in great detail. You will study the principles of operation of both Michelson and Fabry-Perot interferomenters. In this experiment you will measure the fine structure splitting in sodium. If you go on the the Zeeman splitting experiment, you will then be prepared to use an interferometer to resolve the exceedingly small energy level splitting which occurs when a mercury atom is placed in an external magnetic field.
A. Monochromator:
The apparatus for part A includes:
- MacPherson 1 m normal incidence monochromator.
- StellarNet PC based spectrometer and associated software.
- Various discharge tubes (hydrogen, mercury, neon, nitrogen, sodium, etc. ) and necessary voltage supply (BE CAREFUL: the supply voltage of 5 kV is potentially lethal).
Supplementary documents include:
- StellarNet Manual
Experiment
1. The StellarNet PC based
spectrometer: This spectrometer operates on the same principle as the MacPherson, but with a diode array in the focal plane with
parallel readout. It has more coverage and great convenience but poorer
resolution. Use this spectrometer to survey the spectra of H, Na and Hg.
Identify the main lines in each spectrum, measure their wavelengths and
indicate in your writeup what each transition
corresponds to (initial and final states) using spectroscopic notation. You
should review your understanding of the quantum numbers n, l, s and j for one
electron atoms and L , S and J for the two-electron
atom. Use pages 21-43 in Melissinos and Napolitano as reference material. Be
sure you also understand how the selection rules work. Include in your write up
a spectrum from each with the main lines identified. What is the resolution of
this instrument? Can you resolve the fine structure splitting in Na? In
your writeup, show spectra for each element with the
main lines identified, and an energy level diagram for each element indicating
which lines you observed in the spectrum.
1. Monochromator operation: Open the MacPherson UV monochromator and examine (but do not touch!) the optics inside. The major components of this instrument are the entrance and exit slits, two concave mirrors and a plane grating. Monochromatic light emerging from the entrance slit will be focused at infinity by the first concave mirror. It then is reflected from the grating at an angle determined by the constructive interference requirement. Make a drawing of the optics of the instrument and be sure you understand how it works. Derive the condition for constructive interference in terms of the angles of incidence and reflection from this grating. Note that these angles do not have to be equal: the grating is not a mirror. Upon reflection from the grating, the light is refocused onto the exit slits. As the angle of the grating is scanned, different wavelengths are sent onto this slit. Derive the expression for the dispersion of the instrument, defined as dl/dx, where x is the lateral distance across the exit slit and l the wavelength of the light. Your grating has 1200 lines/mm and a 1 m focal length. Calculate the dispersion in nm/mm.
Now measure the dispersion. Illuminate the entrance slit of the monochromator slits with a Hg discharge lamp and set the monochromator dial to the green line at 5460 Angstroms. Set the entrance slit to 0.1 mm and open the exit slit to 2 mm. Using the web cam detector and the motorized drive on the monochromator driving at a slow speed, scan the image across the exit slit and determine how many nm the 2 mm corresponds to. Does this agree with your calculated dispersion? What are some of the factors which limit the ultimate resolution of the monochromator? What do you think the ultimate resolution is, and what is the most important factor?
3. High resolution spectroscopy with the MacPherson:
Using narrow entrance slits (0.1 mm or less) and the web-cam detector, this instrument is capable of a resolution of the order of 0.02 nm or so. This is more than an order of magnitude better than the StellarNet. You will use this to measure two features which are unresolvable with the StellarNet:
Measure the difference in wavelength of the Balmer alpha line in hydrogen and deuterium. As discussed on pages 232-236 in MN, the energy levels of these isotopes are slightly different because the reduced mass of the electron-nucleus system is different in the two cases. Be sure you understand why and can derive the expected difference in wavelengths. Measure this difference using a deuterium-filled discharge tube. This tube has both deuterium and hydrogen in it, so you will see light from both atoms. Set the spectrometer so that both lines are in view at the same time on the web cam display, and record the spectra. Using the SCION software, capture the image, project it along the wavelength axis and plot it out. Calibrate the scale in nm. You can determine the number of pixels per mm using an image with a know size image (for example the slit width) and the dispersion you determined above.
B. Interferometers
Your apparatus for part B includes:
Atomic laboratories interferometer—use for Fabry-Perot optics only.
Gaertner Michelson interferometer—the superior instrument.
Low pressure mercury source and filter to select 5460 A green line.
Sodium lamp.
White light.
Several discharge tubes.
The purpose
of this experiment is to give you experience in working with Michelson and Fabry-Perot interferometers. In the case of the Michelson interferometer
light from a monochromatic source is split into two beams, sent along different
optical paths and then recombined.
Constructive interference occurs if the difference in the optical paths is ![]() . By changing one path
(changing distance, index of refraction, etc.) alternative destructive and
constructive interference is obtained and the number of times this cycle is
repeated measures the change in optical path in wavelengths. The Fabry-Perot
interferometer works in a similar way except that many beams, rather than only
two, are used. It is thus intrinsically
capable of much higher sensitivity to optical path changes, or resolution. A discussion of these interferometers is
given in MN on pages 167-177, and an alternative discussion is offered below.
. By changing one path
(changing distance, index of refraction, etc.) alternative destructive and
constructive interference is obtained and the number of times this cycle is
repeated measures the change in optical path in wavelengths. The Fabry-Perot
interferometer works in a similar way except that many beams, rather than only
two, are used. It is thus intrinsically
capable of much higher sensitivity to optical path changes, or resolution. A discussion of these interferometers is
given in MN on pages 167-177, and an alternative discussion is offered below.
Several experiments are described in the Atomic Laboratories manual. For this laboratory do the following ones:
For each interferometer,
a) Measure the wavelength of the green line of mercury.
b) Measure the fine structure splitting in Na.
For the Michelson interferometer,
c) Find, and explore, white light fringes.
************************************************************************
Supplemental note on interferometers:
A useful
way to analyze the patterns you see with either interferometer is to construct
the images which the plane mirrors generate.
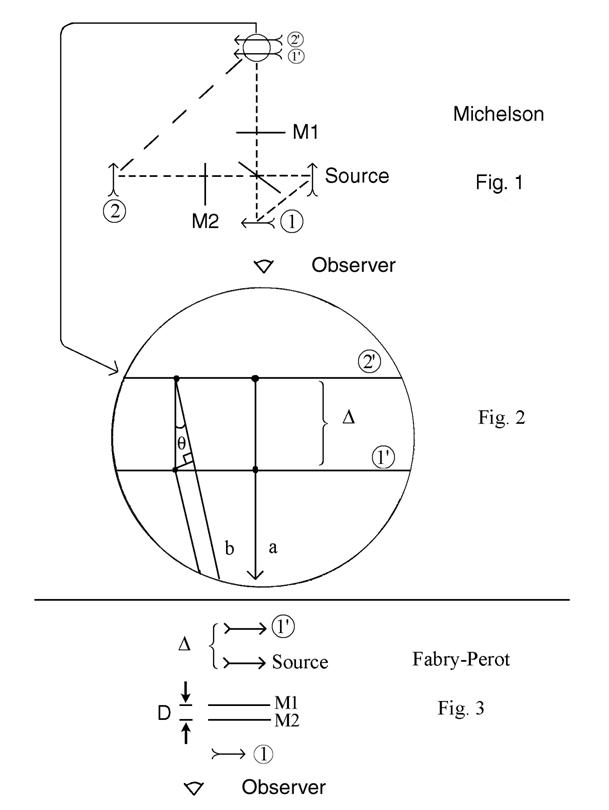
Figure 1 shows show it works for the Michelson interferometer. The source light can reflect off the half
silvered mirror to form image 1, then off M1 to form image ![]() . On the other path,
the light reflects first from M2 to form image 2, then off the half-silvered mirror
to form image
. On the other path,
the light reflects first from M2 to form image 2, then off the half-silvered mirror
to form image ![]() . Now the observer
“sees” images
. Now the observer
“sees” images ![]() and
and ![]() both sending light to
her eyes. A blow-up of a section of
these images is seen in Fig. 2. If
the images are separated by
both sending light to
her eyes. A blow-up of a section of
these images is seen in Fig. 2. If
the images are separated by ![]() , then light which is viewed perpendicular to the plane of
the image (path a) will give constructive interference for
, then light which is viewed perpendicular to the plane of
the image (path a) will give constructive interference for ![]() . Notice that if M1 is
moved a distance d, then image
. Notice that if M1 is
moved a distance d, then image ![]() will move a distance
2d, so that one will go from constructive back to constructive interference for
light viewed along path (a) if one moves M1 by d so that
will move a distance
2d, so that one will go from constructive back to constructive interference for
light viewed along path (a) if one moves M1 by d so that ![]() . If one observes the
images at an angle
. If one observes the
images at an angle ![]() to the perpendicular
to the plane of the images, (path b) the path difference between light from a
point on image
to the perpendicular
to the plane of the images, (path b) the path difference between light from a
point on image ![]() and the equivalent
point on image
and the equivalent
point on image ![]() will be
will be ![]() . Thus if the interferometer
is set for constructive interference when viewed
. Thus if the interferometer
is set for constructive interference when viewed ![]() , it will go away from this condition as
, it will go away from this condition as ![]() is increased, going
into destructive, then constructive, interference etc. as the
is increased, going
into destructive, then constructive, interference etc. as the ![]() increases and the path
differences changes one, two,…wavelengths.
If the images are parallel, as shown, the picture will by cylindrically
symmetric around
increases and the path
differences changes one, two,…wavelengths.
If the images are parallel, as shown, the picture will by cylindrically
symmetric around ![]() , and one will see rings.
Note that if M1 or M2 is tilted, image
, and one will see rings.
Note that if M1 or M2 is tilted, image ![]() or
or ![]() will be tilted, so
that looking at different POSITIONS on the sources will give different path
differences and will lead to stripes.
will be tilted, so
that looking at different POSITIONS on the sources will give different path
differences and will lead to stripes.
Q: Why stripes? What determines the spacing of the stripes?
You can see why tilting one of the images will make it easier to find a location of M1 for which zero path difference occurs (images intersec) and white light fringes appear.
For the Fabry-Perot, a similar picture leads to multiple
images. For example, the source of
Fig. 3 is reflected by M2 to form an image at 1, and then by M1 to form an
image at ![]() . The image at
. The image at ![]() now “emits” light
which interferes with that from the source.
The geometry for these two images is the same as in Fig. 2, and
will again give rings. Note that
now “emits” light
which interferes with that from the source.
The geometry for these two images is the same as in Fig. 2, and
will again give rings. Note that ![]() is 2D, where D is the
plate spacing in the Fabry-Perot. In this case, because multiple reflections
occur between M1 and M2, a series of images behind
is 2D, where D is the
plate spacing in the Fabry-Perot. In this case, because multiple reflections
occur between M1 and M2, a series of images behind ![]() will be formed, spaced
will be formed, spaced
![]() apart, each becoming a
little weaker. The cooperative
interference of all of these images leads to higher resolution.
apart, each becoming a
little weaker. The cooperative
interference of all of these images leads to higher resolution.