1/16/03
clc
Franck-Hertz experiment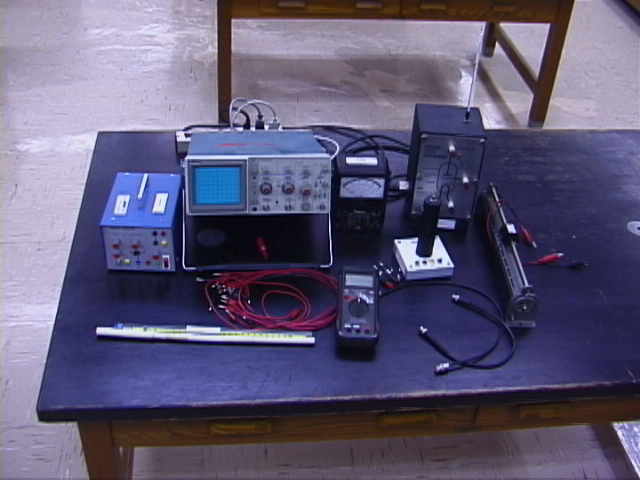
This experiment demonstrates the quantization of energy levels of isolated atoms. Electrons are emitted from a hot filament (cathode) of a vacuum tube and accelerated across a gap to the (transparent) anode in the presence of a fill gas. They then go through a short deceleration region and are collected on the collector of the tube. The current through the tube is measured. When the acceleration voltage gives the electrons an energy sufficient to excite the first excited state of the fill atoms, the electrons may lose a quantum of energy in the collision, thereby losing enough energy that they can no longer reach the anode. Thus a dip in the observed tube current will occur. As the acceleration voltage is raised further, the electrons may lose two, three, .... quanta of energy at voltages corresponding to multiples of the excitation energy. Thus a plot of tube current versus acceleration voltage displays regular dips. From this plot the excitation energy of the atomic energy levels of the fill gas can be calculated.
The experiment is described in Tipler and Llewellyn on pp. 185-188. Read this before you start. You will use a CENCO Neon tube . You can see light and dark regions in the acceleration region as you raise the voltage. Use the NEVA control box, which incorporates the filament supply, acceleration voltages and amplifier for the tube current. It can be used to either take point-by-point current versus voltage data or so that the oscillations are seen on the oscilloscope display (see NEVA instruction manual). See if you can do it both ways. )
Experiment: Measure and plot the tube current versus the acceleration voltage, and deduce the energy of the first excited state(s) of neon from your data.
The apparatus includes:
- NEVA control box, incorporating filament supply, anode-cathode supply, retarding voltage, amplifier for tube current.
- Oscilloscope capable of XY display.
- Ne Franck Hertz tube (CENCO).
- Various leads and cables.
*************************************************************************************************************
SUPPLEMENT:
THE FRANCK-HERTZ EXPERIMENT- CENCO WRITEUP
1. Purpose
You can demonstrate the 1926 Nobel Prize Winning Franck-Hertz Experiment with this alternate method that uses a neon-filled tube. The concepts of quantum theory are verified as several well-defined minima can be observed on your oscilloscope screen, as the electrode current produced by the control unit excites the neon resonance line.
Although not as many minima are observed as when using a mercury-filled tube, the experiment in neon offers two distinct advantages: 1.) The neon excitation zones can be seen by the red light neon emissions, and the zones can be investigated with a spectroscope. 2.) There is no need to maintain critical temperatures as in our Complete Franck-Hertz Experiment Set that uses a mercury-filled tube; in fact, the experiment is performed at normal room temperatures.
2. Description
The apparatus consists of a neon-filled Franck-Hertz tube in a housing; a control unit with power supplies, reverse voltage source and DC preamplifier; and a shielded cable with BNC connectors. (For use, you will need to add an oscilloscope with X-Y facility, such as our 32046 Dual-Trace 20 MHz Oscilloscope.)
A. The neon-filled Franck-Hertz-tube is a tetrode with an indirectly heated barium oxide cathode, a grid-type control electrode, an anode grid, and a collector electrode. The electrodes are placed in parallel planes. The distance between the control grid and the anode grid is about 5mm, and the cathode-control grid and anode-collector spacings are each approximately 2mm. The neon gas pressure is selected for an optimum characteristic line within production constraints for these tubes.
The connector sockets for the heater, control grid and anode grid are located on the tube's base plate. Collector current in tapped at the BNC connector at the top end of the shielding cylinder. The amplifier is connected to this socket with a shielded cable. A limiting resistor (10 k Ù) is permanently installed between the acceleration voltage connector and the tube anode. This resistor protects the tube if it should arc at excessively high voltage. The voltage drop at this resistor can be ignored when measurements are made, since the anode current in the tube is less than 5ìA (voltage drop at protective resistor = 0.05 V).
B. The control unit provides all voltages required for carrying out the Franck-Hertz experiment and also contains a highly sensitive DC amplifier for measuring the collector current. It is very simple to set up the experiment apparatus using this control unit: It is merely necessary to make four connections to the Franck-Hertz tube and to link up the measuring units.
The power supply section of the control unit delivers:
1. The accelerating voltage Ub = DC voltage, continuously variable from 0 to 60 V (switch "Ub" in setting -).
2. The filament heating voltage for the tube UH = AC voltage up to 8 V. The filament current is adjustable from 270 mA to 350 mA.
3. The opposing voltage UG = DC voltage of about 1.5 V.
The control unit also has these voltage controls for displaying the Franck-Hertz curve on the screen of a cathode ray oscilloscope:
4. A ramp waveform accelerating voltage Ub with amplitude adjustable from 0 to 70 V pp (switch "Ub" in setting ).
5. Voltage for X-deflection on the oscilloscope = (Ub/10).
The DC amplifier included in the control unit consists of two cascaded operational amplifiers (integrated circuits), the first of which is connected as an electrometer amplifier. The current to be measured is applied to the non-inverting input. The input impedance is 680 K Ù. The gain can be adjusted with a variable negative feedback resistance. The subsequent second operational amplifier further amplifies the signal and inverts it. The output display voltage is proportional to the measured current. A voltage of one volt output corresponds to an input current of 0.7 ìA in the minimum sensitivity setting (control knob to the left as far as it will go), and to an input current of 7 nA in the maximum sensitivity setting.
3. Setup
Connections to the operating unit (measurement amplifier) and the voltage source must be made as shown in Figure 1. The banana plug sockets have been color-coded to simplify the hookup. The green heater plug (Heizung) on the tube base is connected to the green heater plug on the control box. The cathode plug (Kathode) on the tube base is connected to the cathode plug on the control unit. The yellow control grid plug (Steuergitter) on the tube base is connected to the yellow control grid plug on the control box. The anode plug on the tube base is connected to the anode plug on the control box, and the BNC collector plug on the top of the tube is connected to the BNC connector (M) on the control box. A Shielded cable must be used to connect the collector electrode to the operating unit. The polarity of the acceleration voltage, the grid-cathode control voltage and the countervoltage must be correct. The negative pole of the acceleration voltage must be connected to the cathode socket. None of the operating voltages may be conductively connected to ground, since the experimental apparatus is already grounded through the operating unit (measurement amplifier).
1. Connect the oscilloscope: From (V +) to Channel 1 (Y-Deflection); From Ub/10 to Channel 2 (X-Deflection); From ground (V -) to ground of Channel 1.
2. Set switch Ub to position .
3. Slowly increase the sawtooth voltage amplitude with the control knob Ub.
4. Procedure
To carry out the Frank-Hertz-Experiment:
The indirectly heated cathode requires a warm-up time of about 90 seconds after you switch on the operating unit. Slowly increase the accelerating voltage (starting from 0 volts), while reducing the "gain" setting, to keep the output reading within the meter range. A current on the order of 10 nA then flows from the collector electrode to the anode. Amplification gain (on the operating unit) or current sensitivity (on the measurement amplifier) should then be set to suitable levels.
Caution: Keep these criteria in mind.
The collector electrode is negative with respect to the anode; be sure that the polarity of any indicators on the measurement amplifier is correct.
The emission current in the tube and therefore the collector current are influenced by the heating current. The heating voltage must be set (within the range 6-8 V) so that no independent discharge occurs at an acceleration of 70 V (recognizable by red light between the cathode and control grid). The countervoltage between anode and collector electrode should be set between 6 and 10 V so that the minima (maximum number = 3) in the current/voltage curve are clearly recognizable. If the countervoltage is too high, a decreasing characteristic line occurs in some cases with negative collector current.
4. Experimental Results and Discussion
If the acceleration voltage is slowly raised from an initial value of zero, a reduction in collector current occurs starting at about 20 V. This is accompanied by the appearance of a flowing red layer at the anode. As the anode voltage is raised further, the collector current decreases and the glow moves toward the cathode. The collector current reaches a minimum when the glowing layer detaches from the anode. As the anode voltage is raised, a dark zone appears, followed by a second glowing layer (at about 40 V). In all, a maximum of two dark zones may be observed (layered positive column).
These layers are created as follows: Electrons emerging from the cathode begin their trajectory at a velocity close to zero, and are all accelerated by the same field, meaning that they also all reach the energy necessary for excitation in the same cross section. Excitation therefore occurs in a layer. In the process, however, all of the electrons lose their energy, begin again with a velocity close to zero, and so on. The layers naturally become blurred after a series of such cycles due to immediate statistical scattering of the excitation sites, and the column gradually becomes homogeneous again.
For exact evaluations of the current/voltage relationship, the iron/barium contact potential of 2.5 V must be subtracted from the acceleration voltage value.
Figure 2. Oscilloscope image of current/voltage characteristic. (See manual.)
Figure 3. Recorder diagram. x: 10V/cm; y: 0.5 V/cm. (See manual.)
As Figure 2 indicates, the voltage difference between the first and second maximum is 19 volts. This value is consistent with the energy diagram for neon (Figure 3) if we assume that the electrons preferentially excite the states between 18.3 and 18.9 eV. This assumption is justified by the fact that 10 states fall within this energy range, compared with four states between 16.57 and 16.79 eV; furthermore, two of these four states are metastable, since the probabilities of optical transitions to the ground state are very small due to the selection rule J = ) 1. The transitions between these two groups of excited states lie in the visible region, and are responsible for the appearance of the glowing layers. This light is accessible to spectroscopic evaluation, and contains several strong spectral lines in the yellow and red regions. The transitions to the ground state lie in the far ultraviolet, and therefore cannot be studied.
5. Maintenance
The Franck-Hertz Experiment in neon needs no special maintenance and should provide trouble-free service. However, if any difficulty develops with any of its components, contact Central Scientific Company, giving details of the problem. So that we can serve you better, please do not return any item to Central Scientific Company until we have sent you a written authorization.
Figure 4. Partial energy diagram for neon. (See manual).