 clc
clc
Sodium spectrum
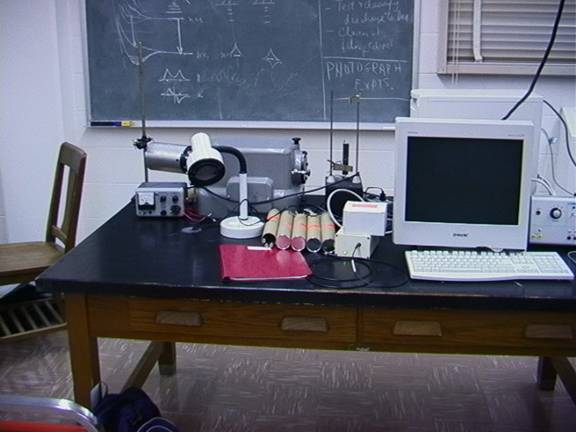
In this experiment you will analyze the light emitted by a
sodium lamp. Your actual data will be taken using a StellarNet
PC based spectometer which uses a grating to disperse
light over the range 250-850 nm onto a photodiode array. The data taking and
display is done automatically by the software provided with the spectrometer,
saving you a lot of work and making the recording of spectra very fast and
efficient. Atomic energy level tables
by
The apparatus includes:
- StellarNet PC based spectrometer and associated software.
- Na discharge lamp
Experiment
Using the StellarNet PC based spectrometer to measure spectral lines of Na:
a. Familiarize yourself with the spectrometer and software. Unless somebody before you fooled around with the settings, it should be calibrated and set to give its best resolution. There are built-in routines for taking spectra, freezing spectra, recording them for printout, zooming, determining wavelength centroids and widths, etc. Play around. Take spectra of colored objects in the room, lights, your shirt, the TV monitor, etc. Record your findings. Where does the light come from in each case?
b. Turn on the Na lamp. It will take at least ten minutes to warm up, so do this early on. It is very bright, so you will probably want to put a piece of paper over the exit to attenuate the light somewhat so it does not saturate the detectors in the spectrometer.
c. Take some spectra of Na and print them out for pasting in your data book. Use the SellarNet software to determine the wavelengths of the 10 or so strongest lines, and record approximately how strong each line is. You will probably have to take spectra with at least two different “intensities” to get both the weak and the strong lines.
d. Make a spreadsheet listing the first 8 levels of Na (i.e., 3s,3p,4s,3d,4p, etc.) in eV, using the data from http://physics.nist.gov/cgi-bin/AtData/display.ksh?XXE1qNaqIXXP-15XXT2XXS (see below also; or use the following table).
|
3s |
3p |
4s |
3d |
4p |
5s |
4d |
4f |
5p |
|
0 |
2.102941038 |
3.190669161 |
3.616092 |
3.751949 |
4.115393 |
4.282488 |
4.287446 |
4.343475035 |
Make a matrix, with each level as both a row and a column. In the matrix calculate the wavelength for the corresponding transition, in nm.
e. Make a table showing the expected and observed wavelengths for the first 10 strongest lines you observe. Identify the upper and lower level for each observed wavelength. Explain why not all transitions in your matrix are seen.


NIST Atomic Spectra Database Levels Data
Na I 286 Lines of Data Found (page 1 of 6)
|
Configuration |
|
Term |
|
J |
|
|
Level |
|
|
|
|
|
|
|
||
|
3s |
2S |
1/2 |
0 |
.000000 |
|
||
|
|
|
|
|
|
|
||
|
3p |
2P° |
1/2 |
2 |
.102298 |
|
||
|
|
|
3/2 |
2 |
.104430 |
|
||
|
|
|
|
|
|
|
||
|
4s |
2S |
1/2 |
3 |
.191353 |
|
||
|
|
|
|
|
|
|
||
|
3d |
2D |
5/2 |
3 |
.616972 |
|
||
|
|
|
3/2 |
3 |
.616978 |
|
||
|
|
|
|
|
|
|
||
|
4p |
2P° |
1/2 |
3 |
.752630 |
|
||
|
|
|
3/2 |
3 |
.753323 |
|
||
|
|
|
|
|
|
|
||
|
5s |
2S |
1/2 |
4 |
.116360 |
|
||
|
|
|
|
|
|
|
||
|
4d |
2D |
5/2 |
4 |
.283498 |
|
||
|
|
|
3/2 |
4 |
.283502 |
|
||
|
|
|
|
|
|
|
||
|
4f |
2F° |
5/2,7/2 |
4 |
.288233 |
|
||
|
|
|
|
|
|
|
||
|
5p |
2P° |
1/2 |
4 |
.344455 |
|
||
|
|
|
3/2 |
4 |
.344761 |
|
||
|
|
|
|
|
|
|
||
|
6s |
2S |
1/2 |
4 |
.509631 |
|
||
|
|
|
|
|
|
|
||
|
5d |
2D |
5/2 |
4 |
.591973 |
|
||
|
|
|
3/2 |
4 |
.591976 |
|
||
|
|
|
|
|
|
|
||
|
5f |
2F° |
5/2,7/2 |
4 |
.594565 |
|
||
|
|
|
|
|
|
|
||
|
5g |
2G |
7/2,9/2 |
4 |
.594799 |
|
||
|
|
|
|
|
|
|
||
|
6p |
2P° |
1/2 |
4 |
.624156 |
|
||
|
|
|
3/2 |
4 |
.624316 |
|
||
|
|
|
|
|
|
|
||
|
7s |
2S |
1/2 |
4 |
.712894 |
|
||
|
|
|
|
|
|
|
||
|
6d |
2D |
5/2 |
4 |
.759415 |
|
||
|
|
|
3/2 |
4 |
.759416 |
|
||
|
|
|
|
|
|
|
||
|
6f |
2F° |
5/2,7/2 |
4 |
.760969 |
|
||
|
|
|
|
|
|
|
||
|
6g |
2G |
7/2,9/2 |
[4 |
.761106] |
|
||
|
|
|
|
|
|
|
||
|
6h |
2H° |
9/2,11/2 |
[4 |
.761136] |
|
||
|
|
|
|
|
|
|
||
|
7p |
2P° |
1/2 |
4 |
.778375 |
|
||
|
|
|
3/2 |
4 |
.778468 |
|
||
|
|
|
|
|
|
|
||
|
8s |
2S |
1/2 |
4 |
.831481 |
|
||
|
|
|
|
|
|
|
||
|
7d |
2D |
5/2,3/2 |
4 |
.860298 |
|
||
|
|
|
|
|
|
|
||
|
7f |
2F° |
5/2,7/2 |
4 |
.861296 |
|
||
|
|
|
|
|
|
|
||
|
7g |
2G |
7/2,9/2 |
[4 |
.861387] |
|
||
|
|
|
|
|
|
|
||
|
7h |
2H° |
9/2,11/2 |
[4 |
.861406] |
|
||
|
|
|
|
|
|
|
||
|
7i |
2I |
11/2,13/2 |
[4 |
.861413] |
|
||
|
|
|
|
|
|
|
||
|
8p |
2P° |
1/2 |
4 |
.872376 |
|
||
|
|
|
3/2 |
4 |
.872437 |
|
||
|
|
|
|
|
|
|
||
|
9s |
2S |
1/2 |
4 |
.906658 |
|
||
|
|
|
|
|
|
|
||
|
8d |
2D |
5/2,3/2 |
4 |
.925733 |
|
||
|
|
|
|
|
|
|
||
|
8f |
2F° |
5/2,7/2 |
4 |
.926410 |
|
||
|
|
|
|
|
|
|
||
|
8g |
2G |
7/2,9/2 |
[4 |
.926472] |
|
||
|
|
|
|
|
|
|
||
|
8h |
2H° |
9/2,11/2 |
[4 |
.926486] |
|
||
|
|
|
|
|
|
|
||
|
8i |
2I |
11/2,13/2 |
[4 |
.926490] |
|
||
|
|
|
|
|
|
|
||
|
9p |
2P° |
1/2 |
[4 |
.933888] |
|
||
|
|
|
3/2 |
[4 |
.933929] |
|
||
|
|
|
|
|
|
|
||
|
10s |
2S |
1/2 |
4 |
.957295 |
|
||
|
|
|
|
|
|
|
||
|
9d |
2D |
5/2,3/2 |
4 |
.970567 |
|
||
|
|
|
|
|
|
|
||
|
9f |
2F° |
5/2,7/2 |
4 |
.971048 |
|
||
|
|
|
|
|
|
|
||
|
9g |
2G |
7/2,9/2 |
[4 |
.971095] |
|
||
|
|
|
|
|
|
|
||
|
9h |
2H° |
9/2,11/2 |
[4 |
.971104] |
|
||
|
|
|
|
|
|
|
||
|
9i |
2I |
11/2,13/2 |
[4 |
.971107] |
|
||
|
|
|
|
|
|
|
||
|
10p |
2P° |
1/2 |
[4 |
.976331] |
|
||
|
|
|
3/2 |
[4 |
.976360] |
|
||
|
|
|
|
|
|
|
||
|
11s |
2S |
1/2 |
4 |
.993017 |
|
||
|
|
|
|
|
|
|
||
|
10d |
2D |
5/2,3/2 |
5 |
.002619 |
|
||
|
|
|
|
|
|
|
||
|
10f |
2F° |
5/2,7/2 |
5 |
.002984 |
|
||
|
|
|
|
|
|
|
||
|
|
|
|
|
|
|