Analyzing
Radius of Gyration and Number of Clusters plots!!!!!!!!
In order to
understand the growth kinetics of my aggregates in my simulations, I analyzed
the average radius of gyration (Rg) and the average number of clusters (Nc) in my
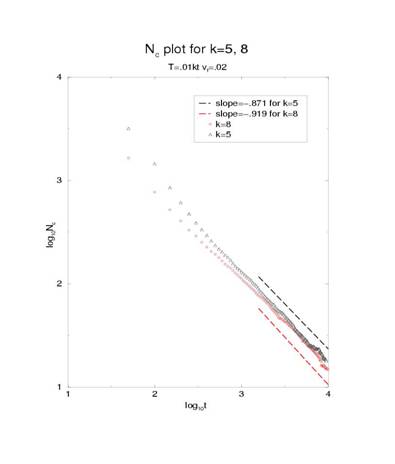
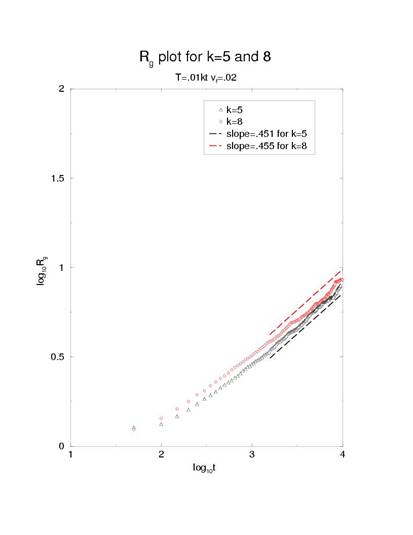
system over a period of time. Log-log plots of both can be seen in
figures (1) and (2) for two different salt concentrations k = 5 and 8.
Upon analyzing the Rg plot, one can see that initially at the early stages in
the simulation the average Rg is small due to the domination of the system by
monomers. However, as time goes on, the monomers begin to aggregate and
the Rg grows like a power law. Finally, in the later stages of the
simulation, the interactions move from happening between monomers themselves
and monomers with clusters to strictly being cluster-cluster aggregation, so
the plot levels out and maintains a constant slope. When you look at the
Nc plot, at early time steps the Nc value starts out big, since we allowed for
monomers to count as clusters themselves. Then, as time goes on, the
monomers begin to interact and aggregates begin to form. Initially,
monomers start interacting and becoming dimers, trimers, and other clusters
containing a low number of monomers. This causes a relatively fast change in
Nc. However, as more clusters begin to form, the slope becomes constant
due to the aggregation between the clusters that have previously been formed in
the system.
See
slideshow for further information on growth kinetics!