
In this
experiment you will observe resonant nuclear absorption of photons. You will use this effect to observe Zeeman
splitting of nuclear states and to measure the magnetic field seen at
the site of the nucleus in natural iron.
Read Melissinos, pp. 265-279.
If a nucleus decays radiatively from an excited state at excitation
energy E to its ground state and the photon were to carry away all the energy
it would have frequency ![]() . If this photon is
now incident on a similar nucleus in its ground state it will have just the
right energy to resonantly excite the system. In fact, however, the photon will not have the full energy E
because the nucleus, of finite mass M, recoils. By momentum conservation, the photon carries off momentum pn=hn/c which is equal to that of the recoiling
nucleus. Thus the recoil energy
. If this photon is
now incident on a similar nucleus in its ground state it will have just the
right energy to resonantly excite the system. In fact, however, the photon will not have the full energy E
because the nucleus, of finite mass M, recoils. By momentum conservation, the photon carries off momentum pn=hn/c which is equal to that of the recoiling
nucleus. Thus the recoil energy ![]() .
.
Q: How big is ![]() for a 14 keV
for a 14 keV ![]() -ray leaving an iron nucleus?
-ray leaving an iron nucleus?
If the
“width” of the emitting state ![]() [=h/(lifetime)] is smaller than
[=h/(lifetime)] is smaller than ![]() , the shift will be enough that resonant absorption will be
lost. Mössbauer found, however, that if
the emitting nucleus is imbedded in a crystal, a fraction of the emissions are
made with the recoil going to the crystal as a whole, in which case the
effective M is enormous and recoil is negligible. Thus resonant nuclear absorption is possible and quite
observable.
, the shift will be enough that resonant absorption will be
lost. Mössbauer found, however, that if
the emitting nucleus is imbedded in a crystal, a fraction of the emissions are
made with the recoil going to the crystal as a whole, in which case the
effective M is enormous and recoil is negligible. Thus resonant nuclear absorption is possible and quite
observable.
The nucleus
you will work with is Fe57 and the decay scheme for ![]() is described in the
write-up on the proportional center.
The 14.4 keV
is described in the
write-up on the proportional center.
The 14.4 keV ![]() -rays from the 3/2- level in 57Fe will
resonantly excite the 57Fe nuclei in the absorber and their
subsequent emission will in general not be toward the detector. If the source is moving toward the absorber
at velocity v the
-rays from the 3/2- level in 57Fe will
resonantly excite the 57Fe nuclei in the absorber and their
subsequent emission will in general not be toward the detector. If the source is moving toward the absorber
at velocity v the ![]() -ray energy seen by the absorber nuclei will be Doppler
shifted up by an amount
-ray energy seen by the absorber nuclei will be Doppler
shifted up by an amount
DE = hn (v/c) , v << c .
Q: Show this.
If ![]() is greater than
is greater than ![]() , resonant absorption is again lost. By measuring the count rate of 14 keV
, resonant absorption is again lost. By measuring the count rate of 14 keV ![]() -rays in the detector as a function of v one can obtain a
very high resolution scan of the photon energies emitted by the source.
-rays in the detector as a function of v one can obtain a
very high resolution scan of the photon energies emitted by the source.

Setting a Window on the Co57 Spectrum
Obtain the spectrum of Co57 on the MCA in the PHA mode. Have your instructor lecture you on safety precautions when dealing with radioactive sources. Identify the 5.5 keV and 14.4 keV lines. A discriminator is available on the MCA enabling you to set up an upper and lower limit on detected energy. This is essentially a single channel analyzer (SCA).
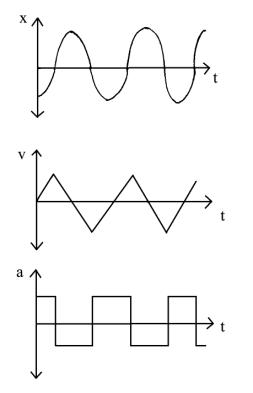
Velocity of Source
The movement of the source is achieved by attaching it to a speaker coil. Feedback electronics are set up to operate the speaker in the constant acceleration mode. In this way the vibrator spends equal time in each velocity increment. The speaker also has a pickup coil which is used to measure the velocity of the coil. This signal may also be used to find the frequency, f. To determine the value of v you need to know f and the amplitude of vibration, xo.
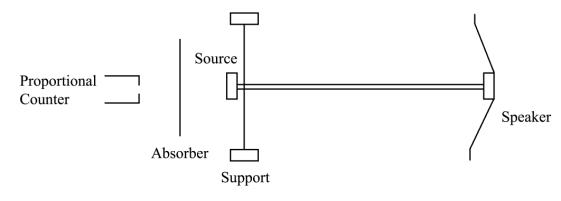
Taking a Mössbauer Spectrum
The Mössbauer spectrum is taken by a multichannel analysis (MCA) in the MCS (multiscaling recurring sweep) mode. The manual for the MCA is available if you require it. In this mode a signal from the drive for the speaker coil at the start of each cycle triggers the MCA to step through each channel with a wait time set on the front of the instrument. During this time any counts that come into the multichannel analyzer increment that channel by one. Note that each channel corresponds to a different velocity. In this way a “counts detected” versus velocity plot may be made.
[Details: Set the MCA mode to PHA, and take a spectrum from the proportional counter. Set the U(pper) and L(ower) thresholds (small screwdriver on back of PCA board on computer) so that only the escape peak from the 14 keV gamma ray are left in the spectrum. Patch the SCA output cable on back of the analzer into the MCA input. Now switch the mode of the MCA to MSC, and set the number of passes to a large number, and dwell time to 2 ms. On the Mossbauer scanning apparatus, use an external oscillator, function generator on triangle wave output, with a TTL output. Put the TTL trigger into the SYNC input of the MCA. Set the scan period to about 950 ms, such that during a half cycle of the oscillator the MCA will advance slightly less than 256 channels. This will put the whole spectrum for positive velocity into a 256 channel range on the MCA. If you prefer , you can change this to get both positive and negative velocities in the spectrum. Adjust the drive box and function generator so the source moves about 2 mm full range. It works fine to tape the absorber foil directly over the PC, and to support the PC independently of the scanning system. The foil must be kept vibration free: do not couple it rigidly to the table. Put it on something soft.]

The Stainless Steel Absorber
Your source
is Co57 in Pt and so the emitting Fe57* (Co57![]() Fe57*
Fe57*![]() Fe57+
Fe57+![]() ’s) nucleus will not see the same environment as the Fe57
in the S.S. and this can result in slight differences in energy levels shifting
the
’s) nucleus will not see the same environment as the Fe57
in the S.S. and this can result in slight differences in energy levels shifting
the ![]() rays up or down
depending on environment. That is, the absorption will not peak at zero
relative velocity.
rays up or down
depending on environment. That is, the absorption will not peak at zero
relative velocity.
Q: What is the difference in energy of the ~14.4 keV line in the source and the absorber? What would cause such a shift?
Q: Use your data to determine the lifetime of the 3/2 level? Compare it with the accepted value.
The Fe Absorber
Natural Iron is ferromagnetic and a strong magnetic field is present at the iron nucleus. Thus both the 3/2- and 1/2- state of the 57Fe are Zeeman split as follows (note: this diagram is drawn for positive g factors for both upper and lower states. In this case, the most outermost absorption lines will have the weakest intensity. If the factors have opposite signs [hint: very likely] this order will reverse).

The energy shifts will be given by ![]() (see Zeeman effect writeup) where
(see Zeeman effect writeup) where ![]() is a nuclear
magneton mN=
he/(4pMp) (Mp=proton
mass) = 1.41x10⁻²³erg/Gauss.
There will be six lines only, due to selection rules (see Zeeman
writeup) , of intensity ratios as labeled in the figure. If the splitting of the upper level is
substantially less than that of the lower level the spectrum will look like
(note: diagram drawn for opposite signs for gI and gF).
is a nuclear
magneton mN=
he/(4pMp) (Mp=proton
mass) = 1.41x10⁻²³erg/Gauss.
There will be six lines only, due to selection rules (see Zeeman
writeup) , of intensity ratios as labeled in the figure. If the splitting of the upper level is
substantially less than that of the lower level the spectrum will look like
(note: diagram drawn for opposite signs for gI and gF).

Q: Where does each line come from?
Q: Find the
transition energy shift ![]() , in terms of gI and gF, for each of
the six lines.
, in terms of gI and gF, for each of
the six lines.
Obtain an absorption spectrum for iron. The absorption will be less now (~5% max) and you will also have to go to about +/- 8 mm/sec to observe the entire spectrum.
The
magnetic moment of the 1/2- ground state is known to be +0.05 ![]() . Deduce from your
data the size (and sign) of the magnetic moment of the 3/2- level
and the average B seen at the nucleus.
. Deduce from your
data the size (and sign) of the magnetic moment of the 3/2- level
and the average B seen at the nucleus.